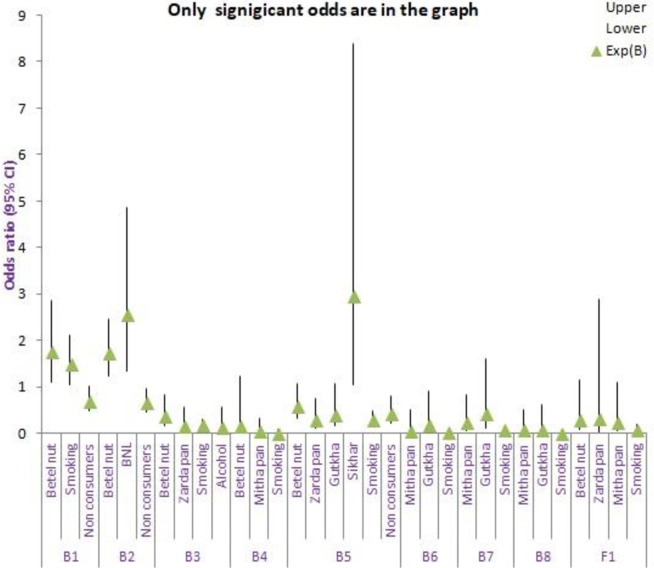
Fig 3. Risk (odds ratio) of incidence of microbes when exposed to intoxicating substances1.
The x-axis represents occurrence of microbes on exposure (consumers) or non-exposure (non-consumers) to intoxicating substances, while the y-axis shows the odds ratio. The triangle symbol represents odds ration/Exp (B). The plot include odd ratio which significantly contributes to the regression. 1 B1 (Staphylococcus), B2(Bacillus), B3(Serratia), B4(Rhodococcus), B5(Pseudomonas), B6(Acinetobacter), B7(Enterobacter), B8(Klebsiella), Fl(Candida) CI-Confidence interval BNL-Betel nut with lime.

