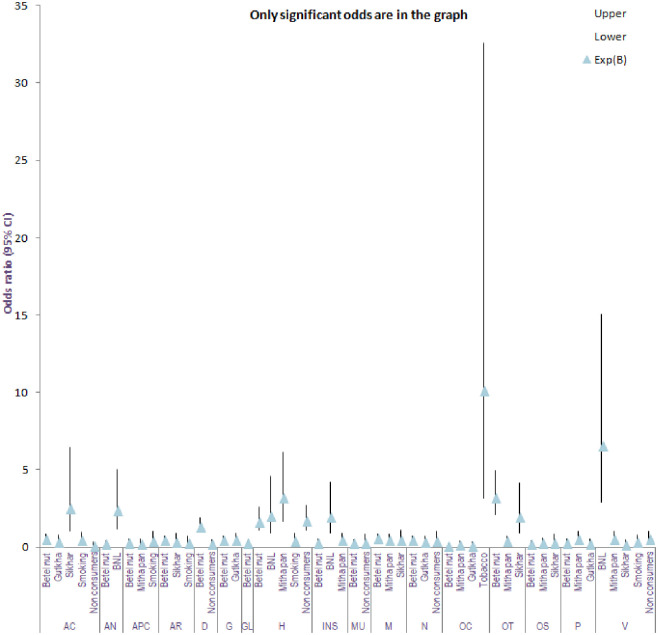
Fig 4. Risk (odds ratio) of health problems1 because of exposure (consumer), non-exposure (non-consumer) to intoxicating substances.
The x-axis represents symptoms/diseases with exposure (consumer), non-exposure (non-consumer), to intoxicating substances, while the y-axis show the odds ratio. The triangle symbol represents odds ratio/Exp (B). The plot include odd ratio which significantly contributes to the regression. 1 Acute cellulites (AC), Anorexia (AN), Appetite condition (APC), Arthralgia (AR), Drowsiness (D), Gingivitis (G), Granuloma (GL), Headache (H), Insomnia (INS), Mouth ulceration (MU), Myalgia (M), Nausea (N), Oral cancer (OC), Oral thrush (OT), Osteomyelitis (OS), Periodontitis (P), Vision (V) Cl-Confidence interval BNL- Betel nut with lime.

