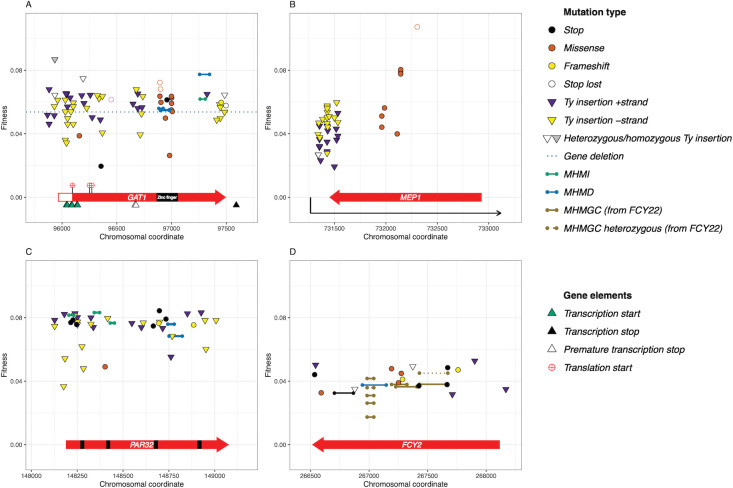
Fig 3. Targets of adaptation and their fitness effects.
A) GAT1, B) MEP1, C) PAR32, D) FCY2 loci and associated adaptive mutations. Glyphs indicate mutation type (see key); the dotted line for GAT1 indicates the fitness of a complete deletion mutant; the black boxes in PAR32 indicate repeat regions.

