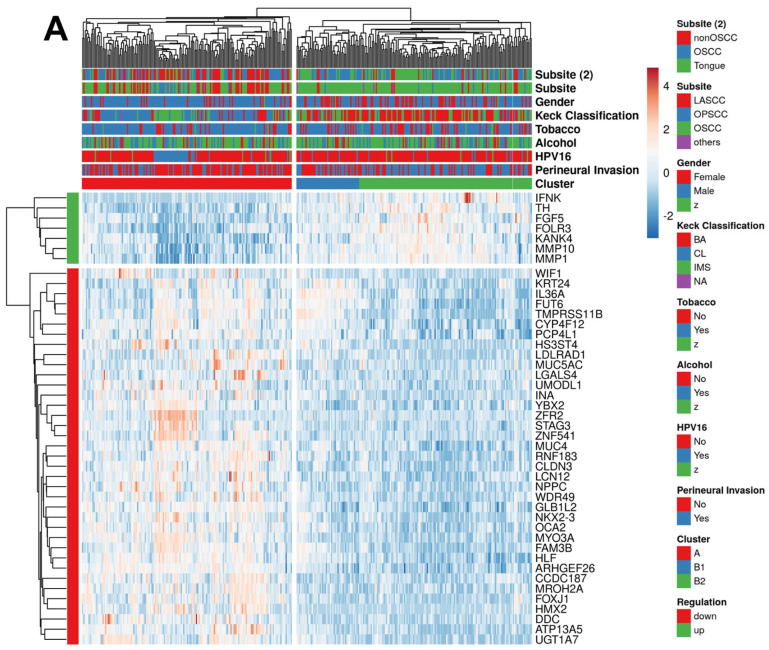
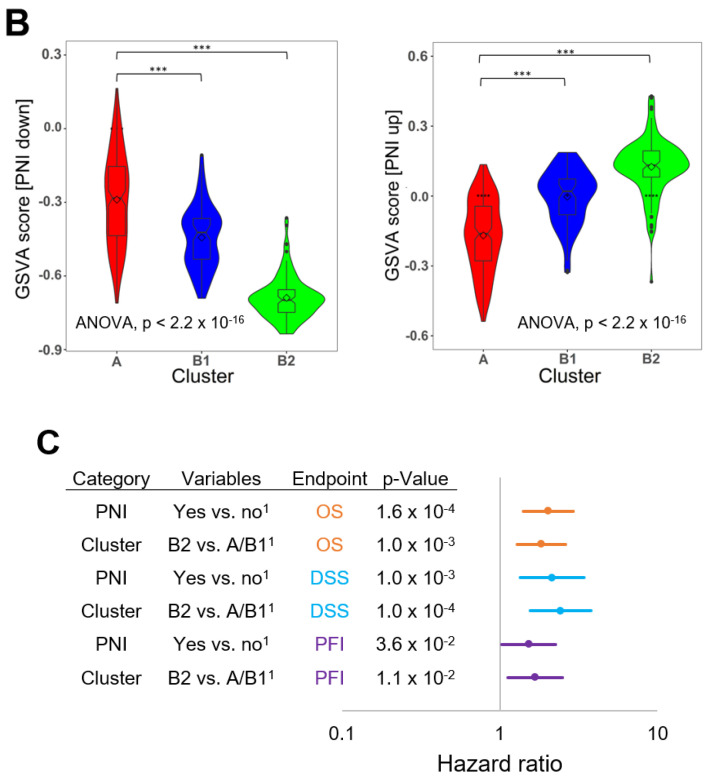
Figure 1.
Identification of subgroups in TCGA-HNSC with annotated PNI status and distinct clinical and prognostic features based on the PNI-related 44-gene set. (A) A heatmap shows an unsupervised hierarchical clustering of tumors from TCGA-HNSC with an annotated PNI status (n = 348) based on gene expression data of the PNI-related 44-gene signature and demonstrates two main groups: cluster A (red, enriched for PNI−) and cluster B, subdivided in subcluster B1 (blue) and B2 (green, enriched for PNI+). (B) Violin plots illustrate a significant difference in GSVA scores of up or downregulated DEGs of the PNI-related 44-gene signature between cluster A (red) and subclusters B1 (blue) and B2 (green). (C) Forest plot for the 5-year OS, DSS, and PFI of patients from TCGA-HNSC with an annotated PNI status based on a univariate Cox regression model stratified by either the pathological PNI status or classified by the PNI-related 44-gene signature. 1 Reference group. * p < 0.05, *** p < 0.0005, **** p < 0.00005, as determined by an ANOVA and Tukey’s post hoc test.


