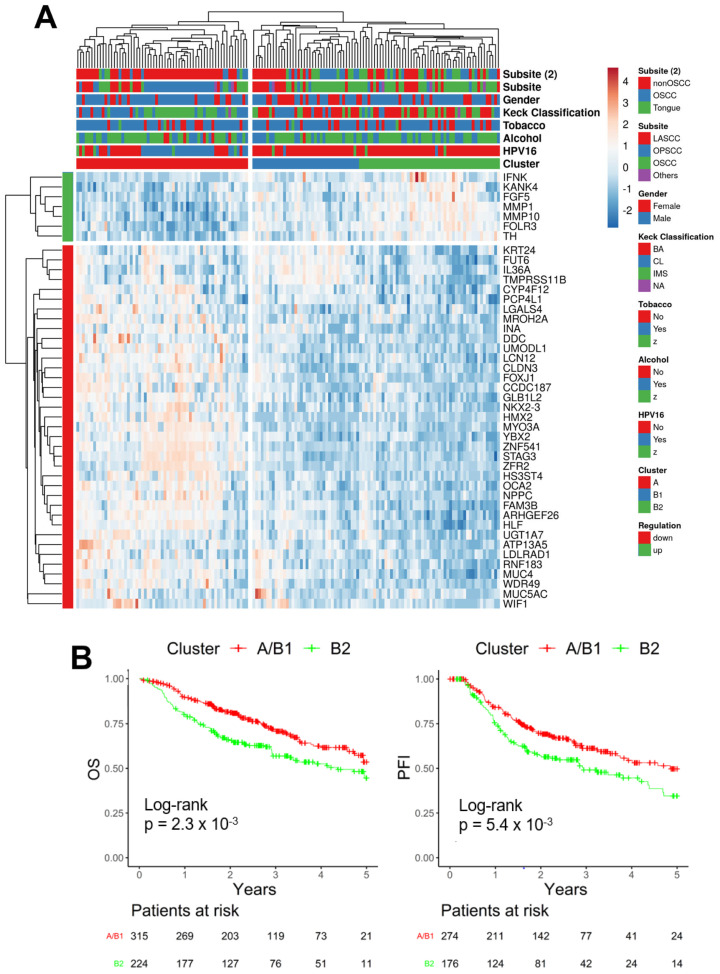
Figure 2.
Expression of the PNI-related 44-gene set identifies clinically relevant subgroups in HNSCC cohorts without annotated PNI status. (A) A heatmap shows an unsupervised hierarchical clustering based on gene expression data of the PNI-related 44-gene signature and confirms two main clusters A (red) and B, the latter subdivided into sub-cluster B1 (blue) and B2 (green) for tumors from TCGA-HNSC without an annotated PNI status (n = 152). (B) Kaplan–Meier plots for 5-year overall survival (OS, left) and 5-year progression-free intervals (PFI, right) for patients of TCGA-HNSC without an annotated PNI status and independent HNSCC cohorts (GSE65858, GSE41613, GSE117973), which were classified into cluster A/subcluster B1 (red) or subcluster B2 (green). Number of patients at risk at the indicated time points are given below.

