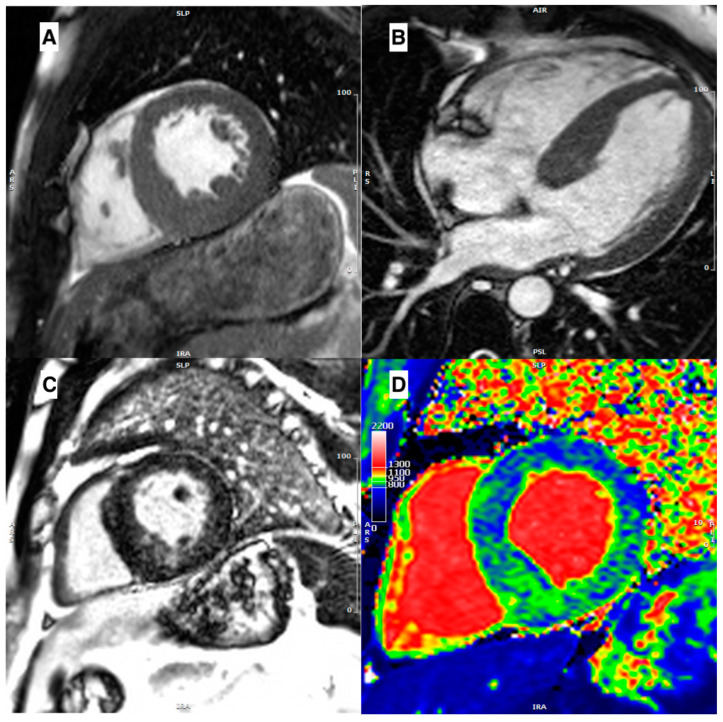
Figure 3.
(A) Mid-ventricular short axis cine-bSSFP image in telediastole and (B) cine-bSSFP 4-chamber image in telediastole, both showing a case of Anderson–Fabry disease with asymmetric septal LV hypertrophy. (C) Mid-ventricular short axis LGE image showing mid-wall LGE in inferoseptum and inferior wall. (D) Mid-ventricular short axis T1 map showing a diffuse reduction of intra-myocardial T1 values, with T1 pseudo-normalization in segments with LGE.

