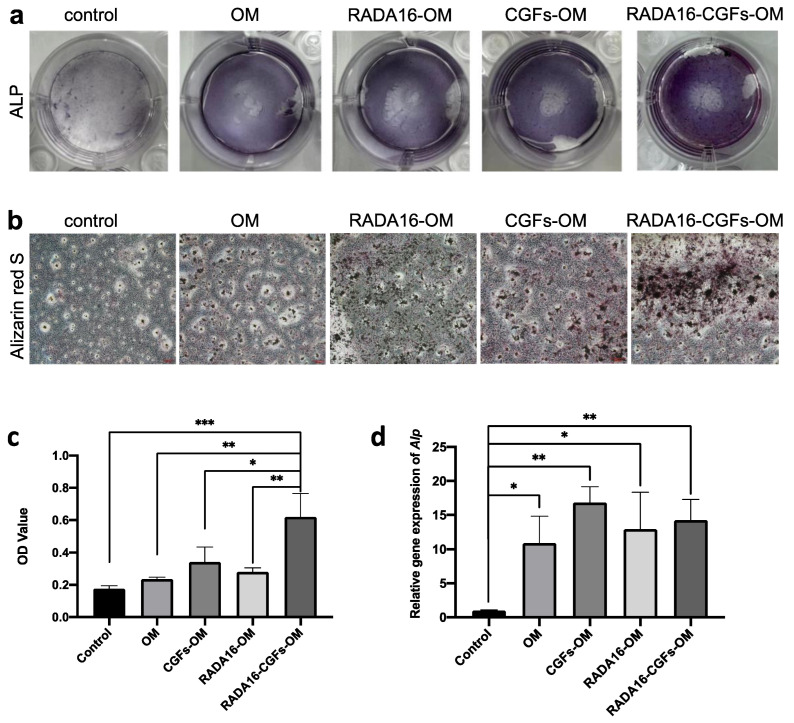
Figure 6.
Effect of RADA16-CGFs on mineralization capability. (a) ALP staining images after culturing on the different composites for 7 days. (b) Optical microscopy images of alizarin red S staining after culturing on the different composites for 21 days. Scale bars, 100 μm. (c) Quantitative analysis of calcium nodules on the composites at a wavelength of 562 nm. *, p < 0.05; **, p < 0.005; ***, p < 0.001. (d) The gene expression of osteogenic differentiation-related proteins (Alp) of MC3T3 cells co-cultured with different composites. *, p < 0.05; **, p < 0.005.

