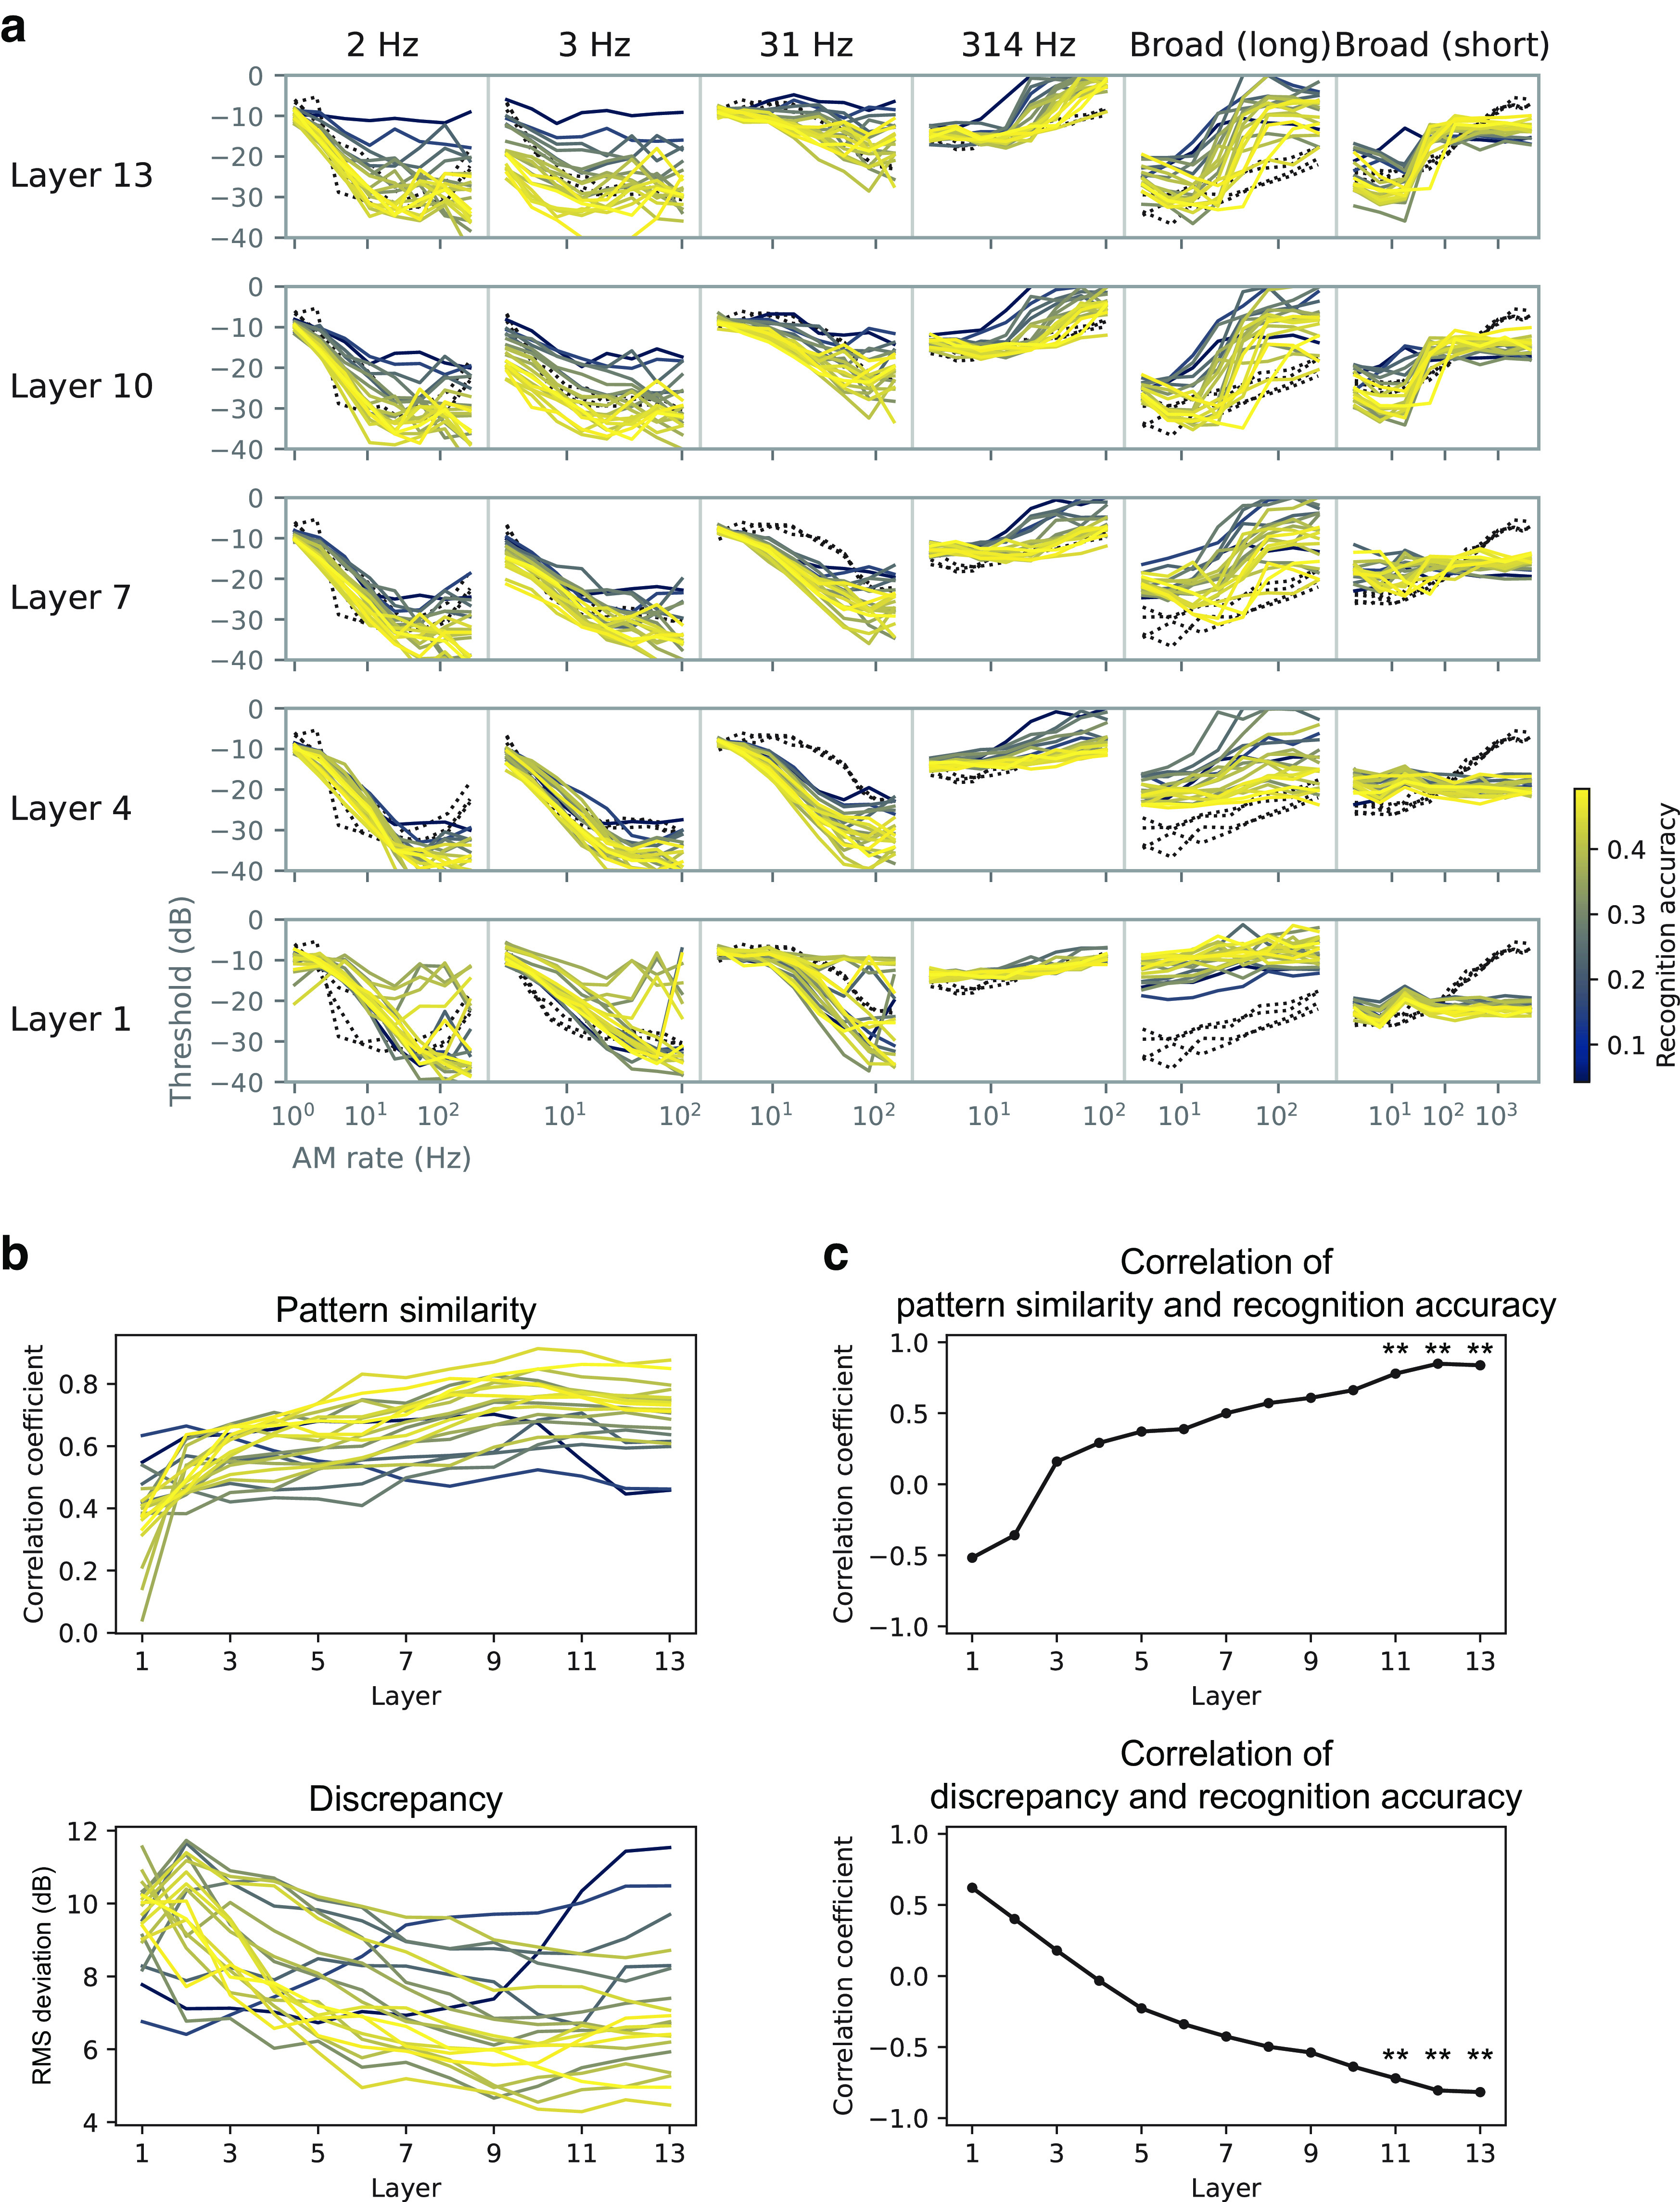
Figure 9.

AM sensitivity in different architectures and its relationship to recognition performance. a, TMTFs in the models with different architectures. Each colored line shows results for a single model with a specific choice of NN architecture. The color indicates the recognition accuracy (legend at right) of the corresponding architecture. Black dotted lines show human TMTFs. b, Pattern similarity and discrepancy indices. c, Correlation coefficients between the (dis)similarity indices and the recognition accuracy. Statistically significant positive and negative correlations were found in the highest layers; **p < 0.01 with a Bonferroni correction for the number of layers.
