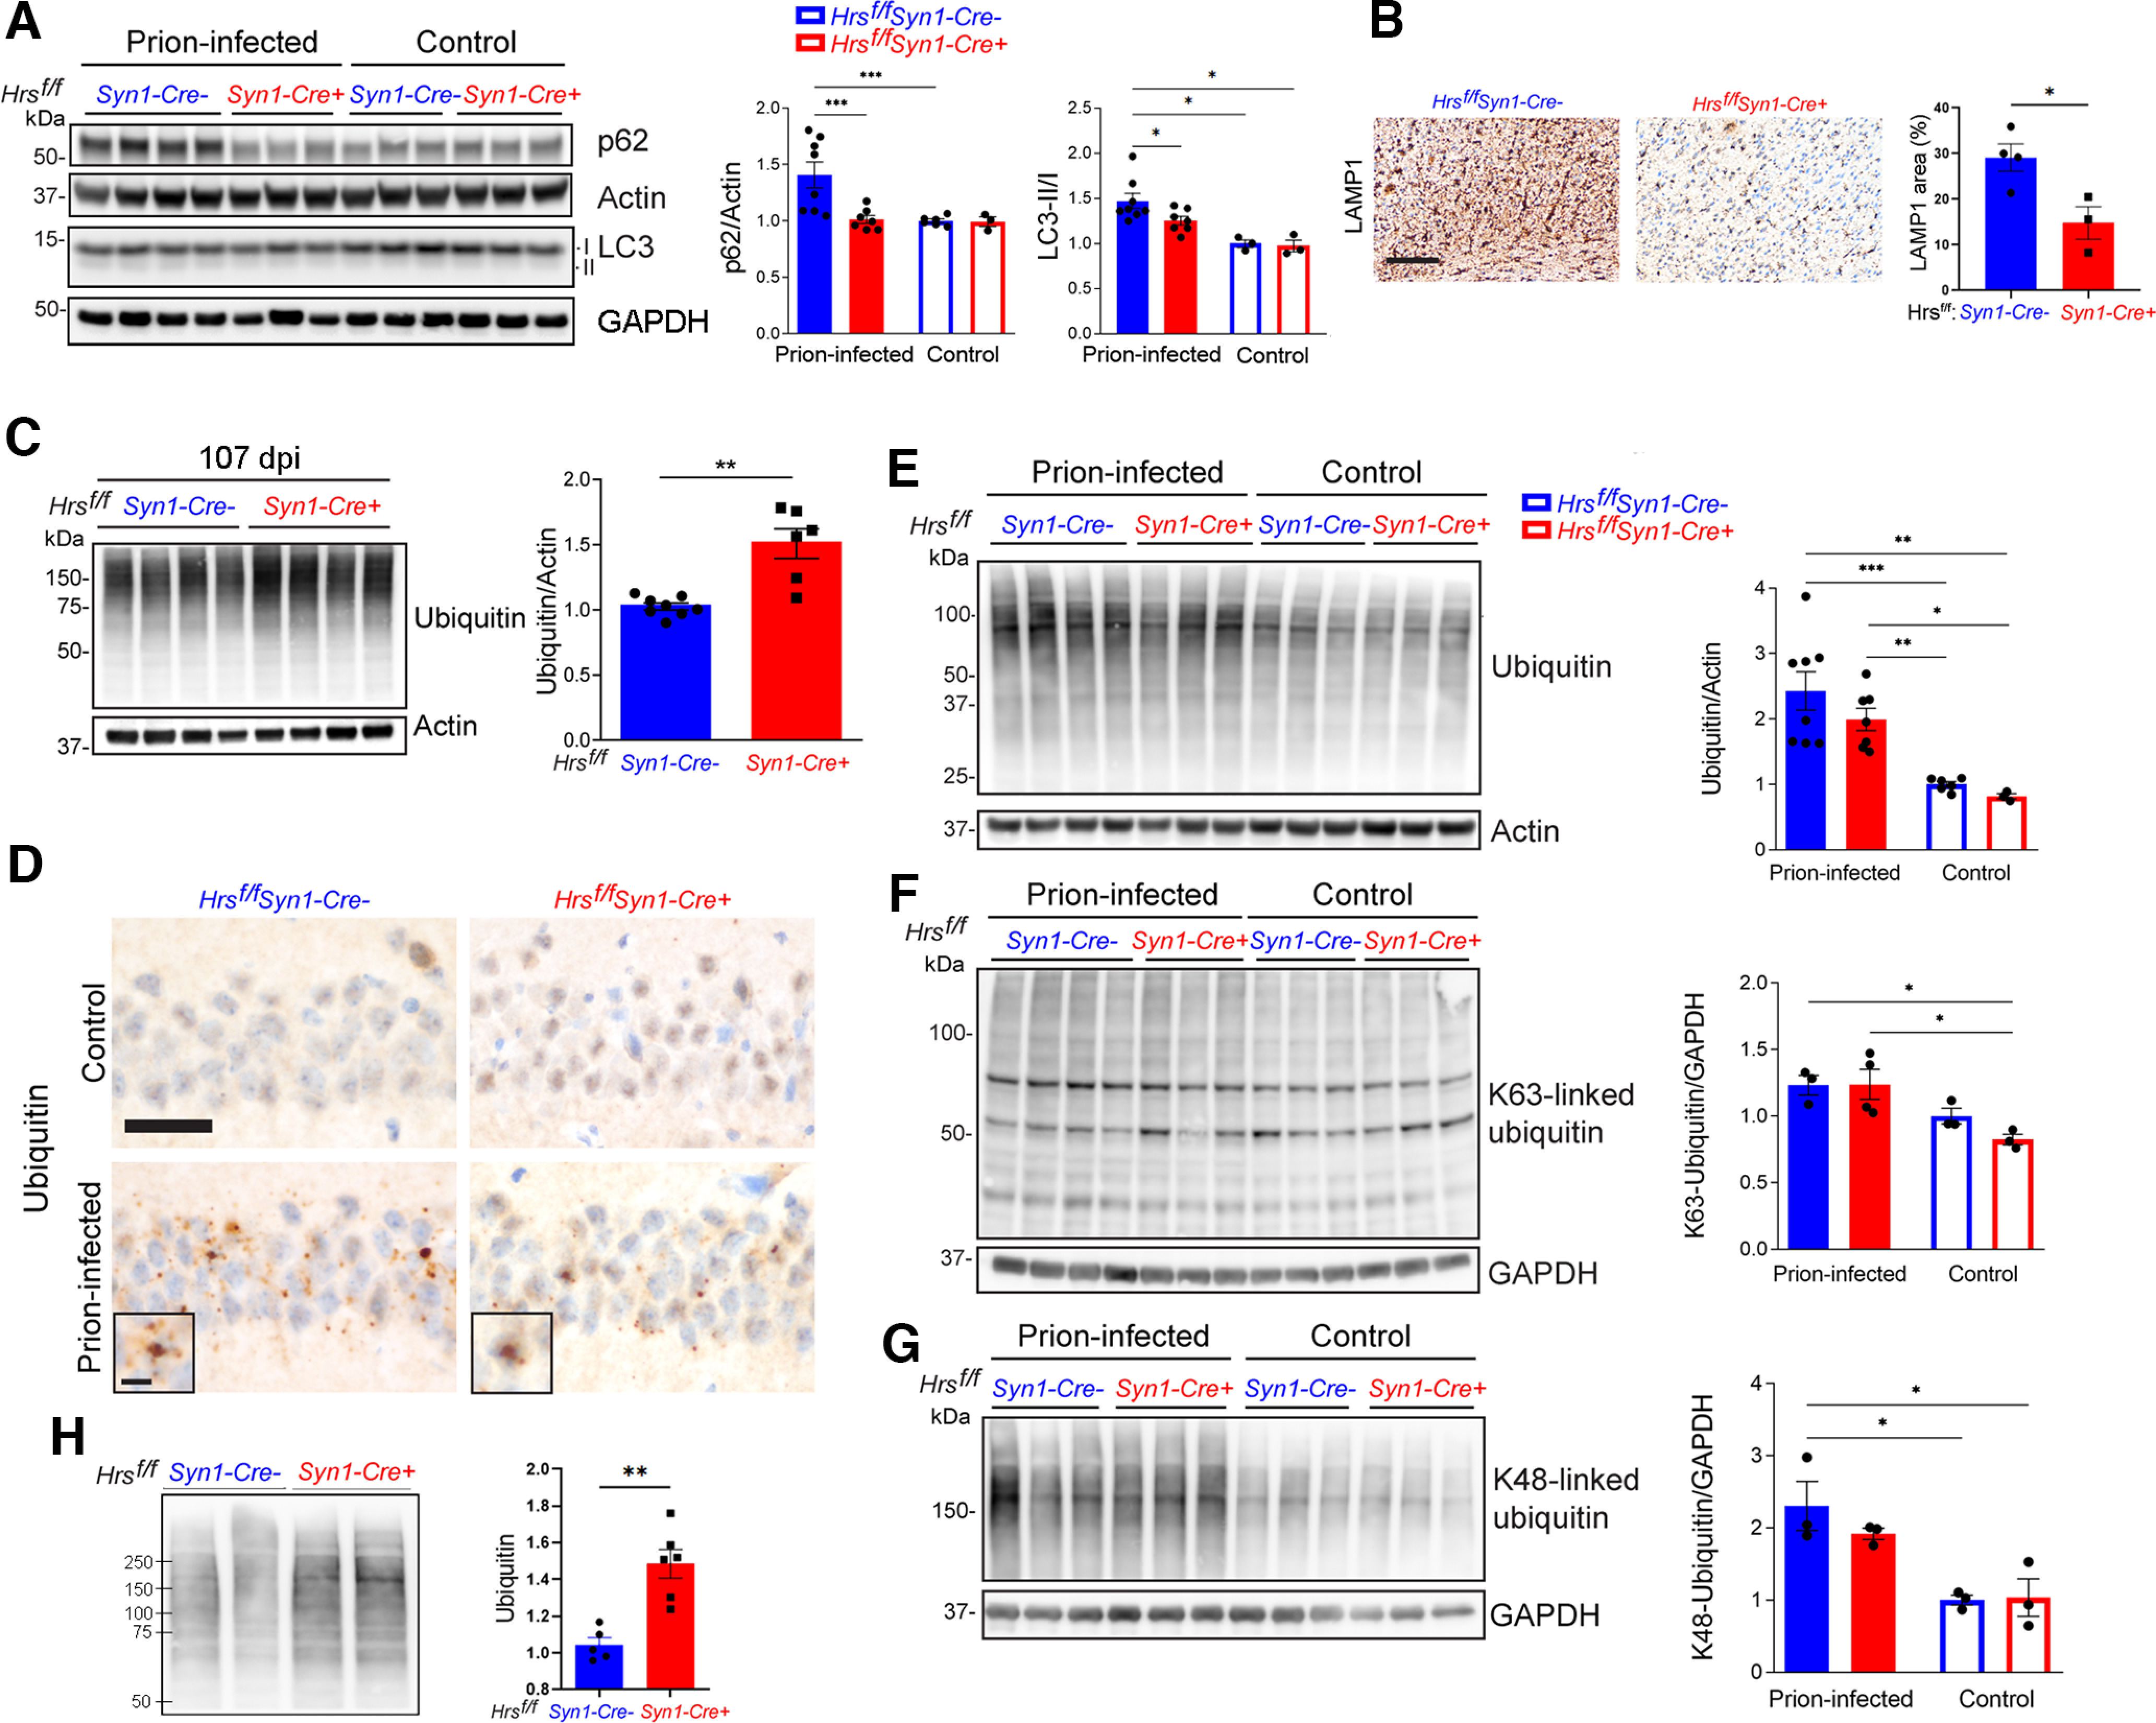
Figure 4.

Neuronal Hrs contributes to ubiquitinated protein clearance in prion disease. A, Representative Western blottings and quantification of p62 and LC3 II/I proteins in brain lysates of age-matched uninfected and prion-infected Hrsf/fSyn1-Cre− and Cre+ mice. B, Terminal prion-infected brain sections immunolabeled for LAMP1 (cerebral cortex) and quantification. C, Representative Western blottings and quantification of total ubiquitinated proteins from prion-infected Hrsf/fSyn1-Cre− and Cre+ mice collected at 107 dpi. D, Uninfected or terminal prion-infected brain sections immunolabeled for ubiquitin. E–G, Representative Western blottings and quantification of total, K63-ubiquitinated, and K48-ubiquitinated proteins in uninfected and prion-infected animals at terminal disease (terminal timepoints for Cre− mice: 127, 138, 136, 144 dpi, for Cre+ mice: 102, 102, 102 dpi). H, Representative Western blotting and quantification of ubiquitinated proteins in synaptosomes collected from Hrsf/fSyn1-Cre− and Cre+ brain at 103 dpi. Data shown as mean ± SEM shown. Relative protein levels were normalized to the average of the uninfected mice (n = 3–8 Hrsf/fSyn1-Cre mice/group for immunoblots). Two-way ANOVA with Tukey's multiple comparisons post hoc test (A, E–G), unpaired, two-tailed Student's t test (C, H). *p < 0.05, **p < 0.01, ***p < 0.001. Scale bars = 200 µm (B) and 20 µm (D). Scale bar = 10 µm for ubiquitin inset (D). Data supported by Extended Data Figures 4-1, 4-2, and 4-3.
