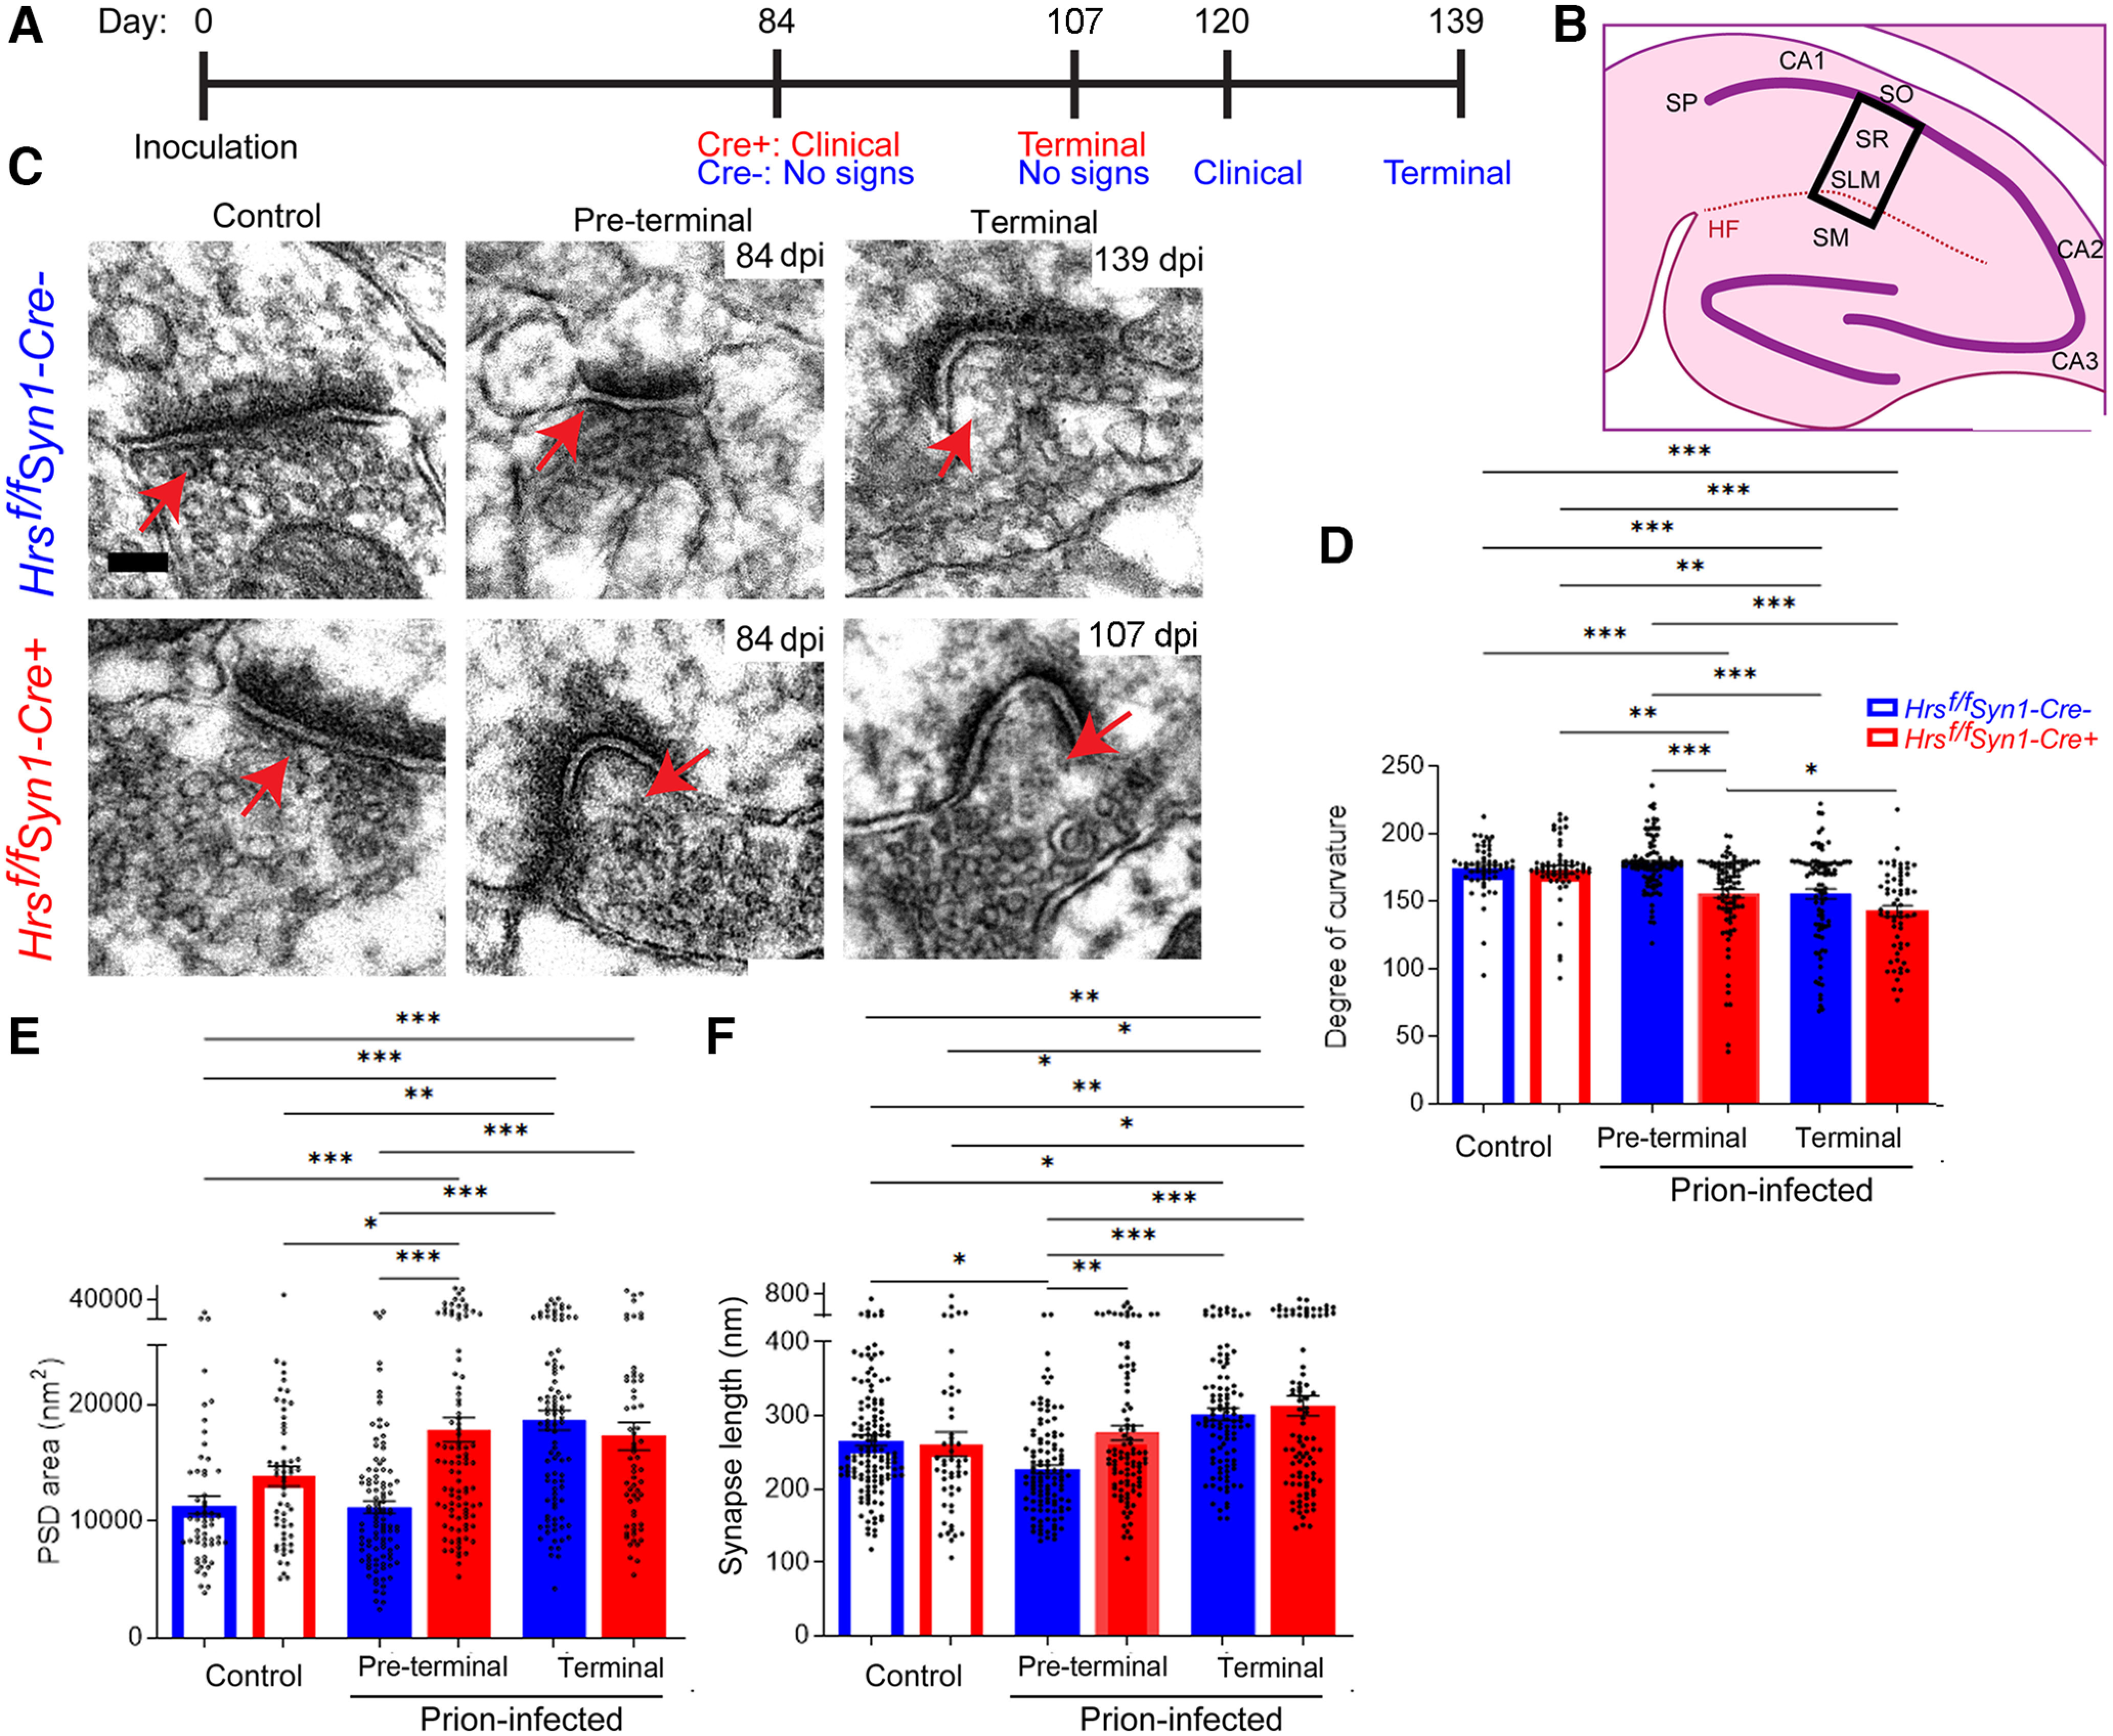
Figure 5.

Neuronal Hrs depletion accelerates severe synaptic structural phenotype in prion disease. A, Timeline depicts the clinical status of the prion-infected Hrsf/fSyn1-Cre+ and Hrsf/fSyn1-Cre− mice at four timepoints. B, Schematic shows the CA1 hippocampal region examined by electron microscopy (boxed). SO = stratum oriens; SP = stratum pyramidale; SR = stratum radiatum; SLM = stratum lacunosum-moleculare; SM = stratum moleculare; HF = hippocampal formation. C, Representative transmission electron microscopy images of uninfected and prion-infected Hrsf/fSyn1-Cre− and Cre+ brain at three disease timepoints. D, Quantification of the degree of curvature of the postsynapse. E, Quantification of the postsynaptic density (PSD) area. (F) Quantification of the synapse length. N ≥ 26 synapses per mouse from 15 mice (Uninfected: n = 2 Hrsf/fSyn1-Cre− and Cre+ mice/group; Prion-infected: n = 5 and 6 Hrsf/fSyn1-Cre−/WT and Cre+ mice, respectively). Data shown as mean ± SEM. Scale bar = 100 nm. One way-ANOVA with Tukey's multiple comparisons post hoc test. *p < 0.05, **p < 0.01, ***p < 0.001.
