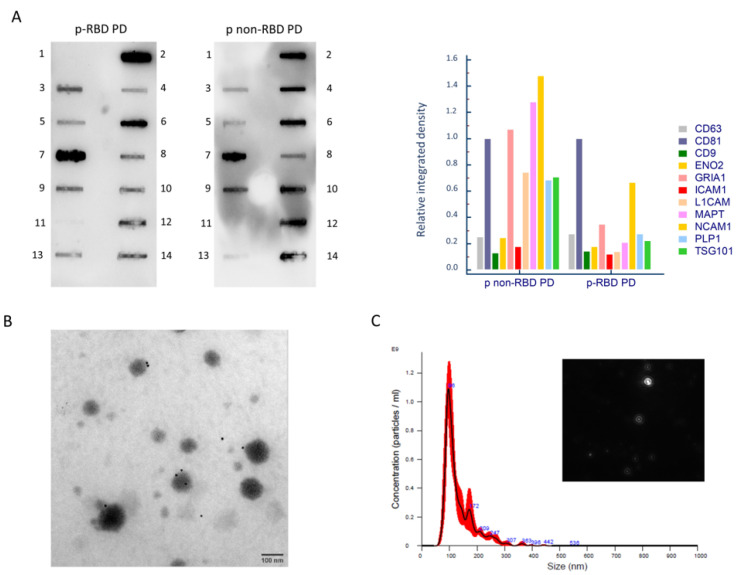
Figure 1.
NDEVs’ characterization. Panel (A). Exo-Check™ Neuro Exosome Antibody Array Neuro on NDEVs’ lysates from representative p-RBD PD and p non-RBD PD patients. In both blots, exosomal-associated markers (lane 3: CD63; lane 5: CD9; lane 7: CD81; lane 9: TSG101: tumor susceptibility 101 protein; lane 13: ICAM1: intercellular adhesion molecule 1) and neurons’ associated markers (lane 4: L1CAM: L1 cell adhesion molecule; lane 6: NCAM1: neural cell adhesion molecule; lane 8: ENO2: enolase 2, lane 10: MAPT: microtubule-associated protein tau, lane 12: GRIA1: glutamate ionotropic receptor AMPA type subunit 1; lane 14: PLP1: proteolipid protein 1) are present. Control markers (lane 1: negative control; lane 2: positive assay control (HRP detection); and lane 11: CANX: calnexin, indicating the lack of cellular contamination). The relative integrated density of bands normalized for CD81 is reported. Panel (B). Immunogold TEM with anti L1CAM antibody micrographs of a representative sample of NDEVs. Scale bar: 100 nm. Panel (C). Representative size distribution graph of NTA that shows size and concentration of NDEVs (black: mean size of three records; red: error bars indicating ± 1 standard error of the mean) in a sample from a p RBD-PD patient and a frame of the video, objective magnification 10×.

