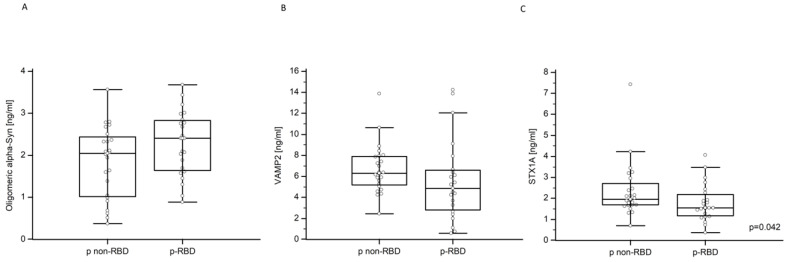
Figure 2.
NDEVs’ oligomeric α-Synuclein, VAMP-2, and STX-1A in p-RBD and p non-RBD patients. Multiple comparison graphs of (A) oligomeric α-Synuclein, (B) VAMP-2, and (C) STX-1A concentration in NDEVs of PD p-RBD and p non-RBD patients. All data are plotted, and the median and interquartile range (IQR) are reported. The reported p values were calculated by the Mann–Whitney U test for non-parametric distributions.

