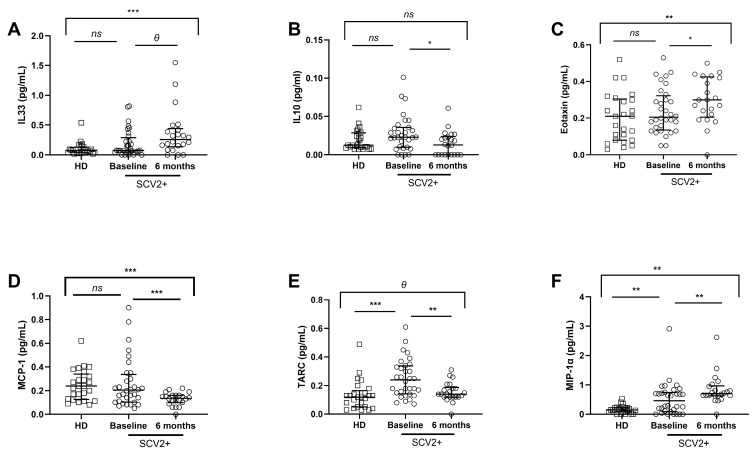
Figure 2.
Soluble pro/anti-inflammatory cytokine and chemokine levels in plasma. Differences at baseline and 6 months later from the SARS-CoV-2 group (data available for 32 and 22 SARS-CoV-2 patients, respectively) and healthy donors (data available for 18 subjects). Soluble IL-33, IL-10, Eotaxin, MCP-1, TARC, and MIP-1α levels’ plasma at baseline and 6 months later (A–F). SCV2+ are highlighted with white dots, and white squares represent HD. Lines represent medians and interquartile ranges. Mann–Whitney U-test was used for group comparisons. Wilcoxon test was conducted to compare paired events in the SARS-CoV-2 group. SCV2+, SARS-CoV-2 group; HD, Healthy Donors. *** p ≤ 0.001, ** p ≤ 0.01, * p < 0.05, Ɵ 0.05 ≤ p ≤ 0.1, ns p > 0.1.

