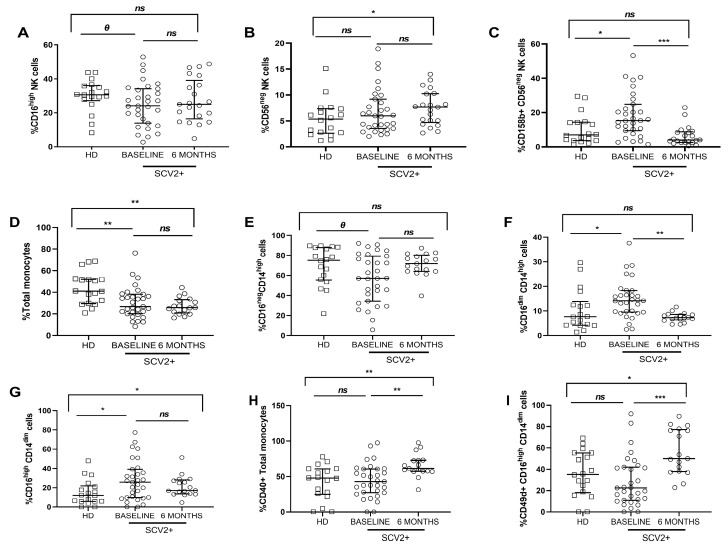
Figure 3.
Frequency of NK and monocyte cell subsets and activation and endothelial adhesion markers expression. Differences at baseline and 6 months later from SARS-CoV-2 group and healthy donors. Frequency of the CD16high NK cell subset (A); frequency of CD56neg and CD158b expression in the CD56neg NK cell subset (B,C); frequency of total monocytes, and proportion of classical (CD16neg CD14high), intermediate (CD16dim CD14high) and patrolling (CD16high CD14dim) monocyte subsets (D–G); CD40, CD49d expression in total monocytes and in the patrolling subsets, respectively (H,I). SCV2+ are highlighted with white dots, and white squares represent HD. Lines represent medians and interquartile ranges. Mann–Whitney U-test was used for group comparisons. Wilcoxon test was conducted to compare paired events in the SARS-CoV-2 group. SCV2+, SARS-CoV-2 group; HD, Healthy Donors’ group. *** p ≤ 0.001, ** p ≤ 0.01, * p < 0.05, Ɵ 0.05 ≤ p ≤ 0.1, ns p > 0.1.

