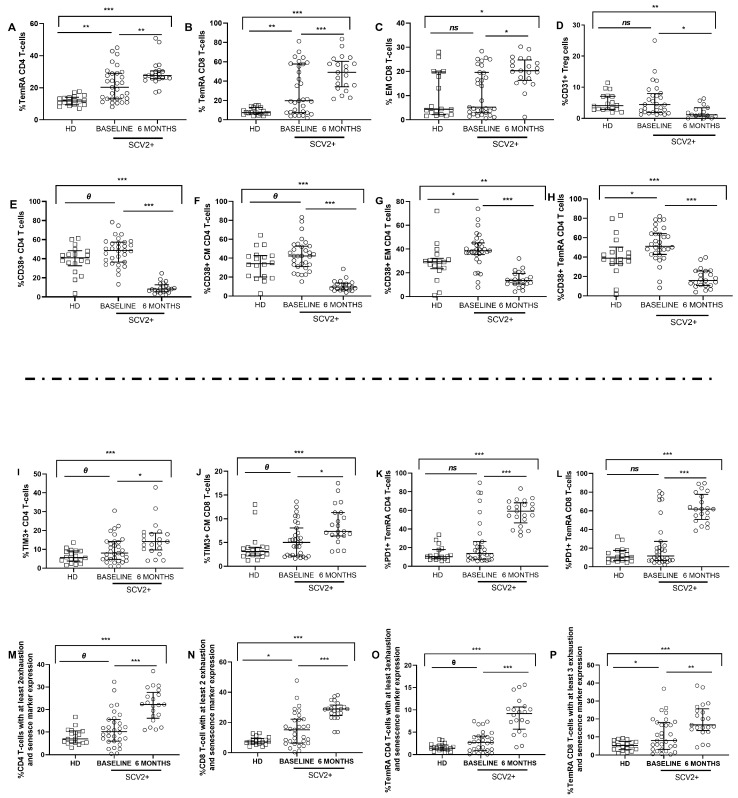
Figure 4.
Maturation profile, activation, exhaustion, and senescence markers on CD4 and CD8 T cells and Treg cells. Differences at baseline and 6 months later. Differences in T-cell memory subsets distribution (A–C); CD31 expression in Treg cells (D); activation markers expression in total CD4 T cells and memory subsets (E–H); TIM3 (I,J) and PD1 expression (K,L) in total and memory T cells. Percentage of expression of at least 2 exhaustion and senescence markers (CD57, PD1, TIGIT, and/or TIM3) in CD4 and CD8 T cells (M,N) and expression levels of at least 3 exhaustion and senescence markers (CD57, PD1, TIGIT, and/or TIM3) in the TemRA CD4 and CD8 T-cells memory subset (O,P). SCV2+ are highlighted with white dots, and white squares represent HD. Lines represent medians and interquartile ranges. Abbreviations: TemRA, terminally differentiated; EM, effector memory; CM, central memory; SCV2+, SARS-CoV-2 group; HD, healthy donors’ group. Mann–Whitney U-test was used for group comparisons. Wilcoxon test was conducted to compare paired events in the SARS-CoV-2 group. *** p ≤ 0.001, ** p ≤ 0.01, * p < 0.05, Ɵ 0.05 ≤ p ≤0.1, ns p > 0.1.

