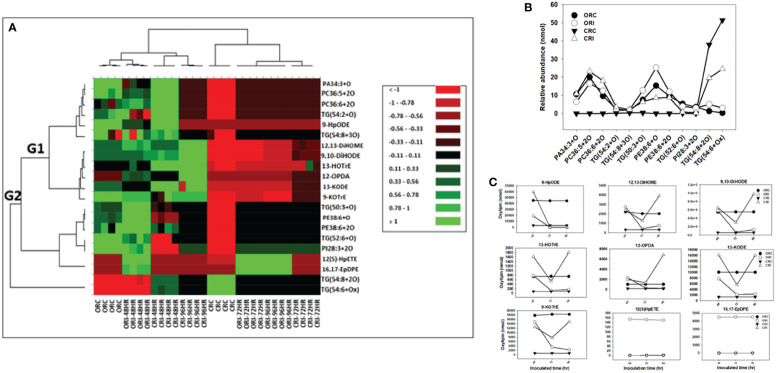
Figure 5.
Changes in phyto-oxylipins biosynthesized in root of both soybean cultivars infected with P. sojae relative to non-infected plants. (A) Heat map showing clusters of oxylipins in susceptible (OX760-6) and tolerant (Conrad) inoculated or non-inoculated with P. sojae. Each soybean cultivar and treatment were clustered independently using ascendant order clustering established on Euclidian distance at 0.15 interquartile range. The left columns represent the cluster-separated root phyto-oxylipins, whereas the top columns separated the cultivars established on similarities in abundance of phyto-oxylipins. Red, black, and green colors denote lower, intermediate, and higher abundance of root phyto-oxylipins. Group 1 and 2 (G1 and G2) are induced phyto-oxylipins that were responsible cluster patterns in the heat map used to determine differences between susceptible and tolerant cultivars; (B) Line graphs showing significant changes in oxidized glycerolipids in the root of both cultivars following inoculation over 96 hours and (C) Line graphs showing significant changes in primary oxylipins in the root of both cultivars following inoculation for over 96 hours. The phyto-oxylipins observed to be significantly different in each group (G1 and G2) of the heat map are displayed in the line graphs. Values represents mean nanomole percent with n = 4 per time point. No detectable response was observed at 24 h of inoculation (data not shown).

