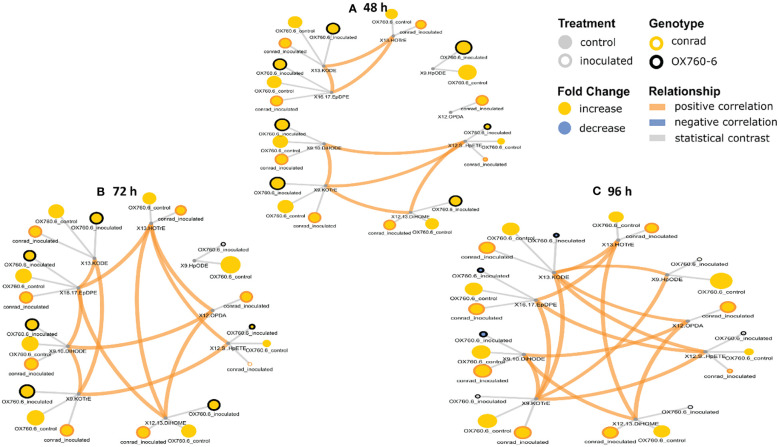
Figure 9.
Oxylipin network displaying differences in stem phyto-oxylipins in susceptible and resistant soybean cultivars following P. sojae inoculation relative to non-inoculated plants. (A) Control and inoculated susceptible soybean stem (OSC and OSI), and control and inoculated tolerant soybean stem (CSC and CSI) at 48 h time point, (B)control and inoculated susceptible soybean stem (OSC and OSI), and control and inoculated tolerant soybean stem (CSC and CSI) at 72 h time point, and (C) control and inoculated susceptible soybean stem (OSC and OSI) and control and inoculated tolerant soybean stem (CSC and CSI) at 96 h time point. The network of phyto-oxylipins demonstrates fold changes in nine stem primary oxylipins following infection with P. sojae. Lipid SMILES identifiers were applied to determine PubChem molecular fingerprints and phyto-oxylipin similarity structure. Mapped structural networks, showing significance of fold changes in phyto-oxylipins were calculated for all comparisons. The network visualizes the phyto-oxylipins with connections established on structural Tanimoto similarity ≥ 0.8 (edge width: 0.8-1.0). Node size shows fold changes of means between comparisons and color demonstrates the direction of alteration compared to control (yellow: increased; blue: decreased; gray: statistical contrast). Node shape shows phyto-oxylipin structural type (gray circle: control, rounded gray: inoculated; rounded yellow: Conrad (tolerant soybean cultivar) and rounded black: OX760-6 (susceptible soybean cultivar), brown = positive correlation and blue = negative correlation. Oxylipins displaying significant differences between treatment groups (p-value ≤ 0.05) are denoted with rounded yellow.

