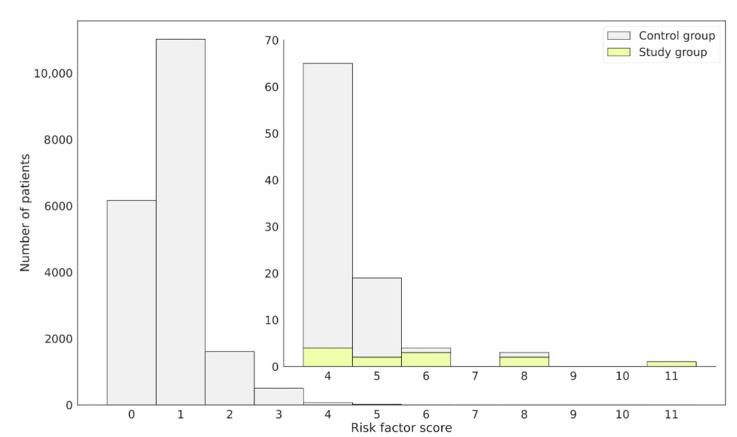
Figure 4.
Distribution of patients assigned to the control or study group regarding the obtained FD risk factor score. Confirmed FD patients, constituting the study group, obtained high-risk score values and were placed on the right-hand side of the plot. The external bars represent the whole patient population, while the internal focus on those having the risk factor ≥4. Bars in yellow represent.

