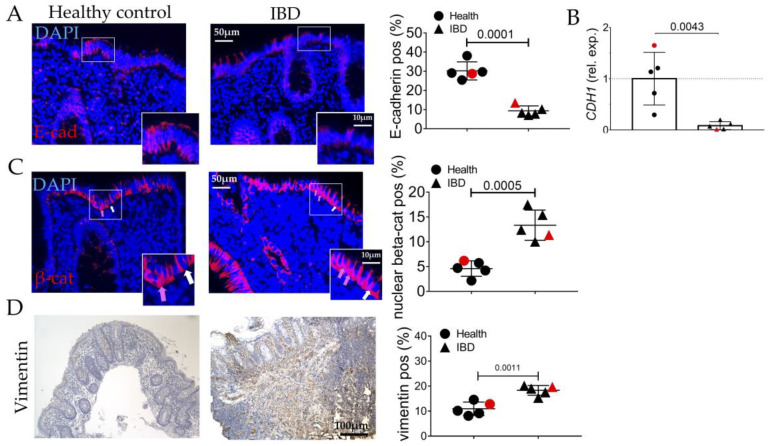
Figure 4.
Evaluation of EMT process in the colonic mucosa of IBD patients. (A) Immunofluorescence and quantitative analyses for E-cadherin (red). Nuclei are counterstained with DAPI (blue); Original magnification 20×, scale bar 50 μm. (B) Quantitative Real-Time PCR for e-cadherin (cadh1) expression. (C) Immunofluorescence and quantitative analyses for beta-catenin (red, white arrows) and its nuclear translation (purple, pink arrows). Nuclei are counterstained with DAPI (blue). (D) Immunohistochemistry and semi-quantitative analyses for vimentin. Nuclei are counterstained with hematoxylin. These images are representative of at least n = 4 subjects/groups. Data were analyzed by unpaired t-test. IBD: inflammatory bowel diseases group. Red symbols indicated biopsies from healthy (red circle) and affected (red triangle) colonic mucosa of the same subjects.

