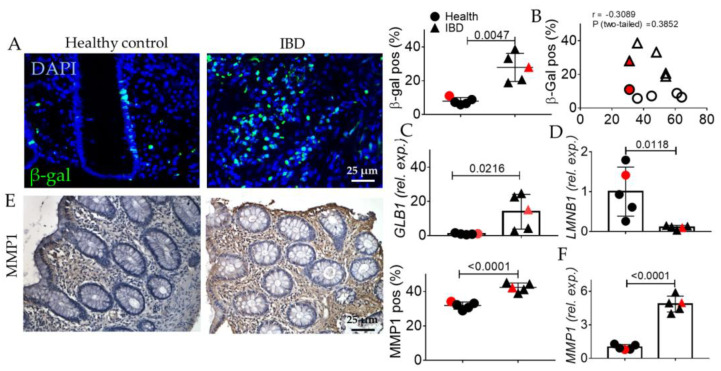
Figure 6.
Evaluation of senescent phenotype in the colonic mucosa of IBD patients. (A) Immunofluorescence quantification of beta galactosidase (green). Nuclei are counterstained with DAPI (blue). (B) Correlation between the age of human subjects and their beta gal positivity. (C) Quantitative Real Time PCR for beta galactosidase (galb1) expression. (D) Quantitative Real-Time PCR for laminin b1 (lmnb1) expression. (E) Immunohistochemistry and quantification of beta MMP1 (brown). Nuclei are counterstained with hematoxylin; Original magnification 20×, scale bar: 25 μm. (F) Quantitative Real-Time PCR for MMP1 expression. These images are representative of at least n = 4 subjects/groups. Data were analyzed by unpaired t-test. IBD: inflammatory bowel diseases group. Red symbols indicated biopsies from healthy (red circle) and affected (red triangle) colonic mucosa of the same subjects.

