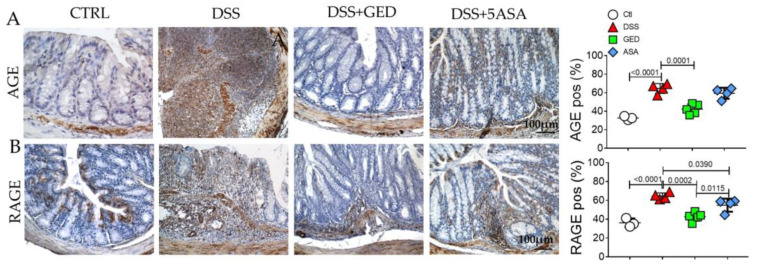
Figure 9.
Evaluation of advanced glycosylation end products signaling in the colonic mucosa of DSS-treated mice. (A) Immunohistochemistry and semi-quantitative analyses for AGE (brown). (B) Immunohistochemistry and semi-quantitative analyses for RAGE. Nuclei are counterstained with hematoxylin; original magnification 10×, scale bar 100 μm. These images are representative of at least n = 3 animals/groups. Data were analyzed by ANOVA (AGE, p < 0.0001; RAGE, p < 0.0001), using Tukey’s test for multiple comparisons (indicated in graphs). Ctl, control; DSS, DSS treated; GED, DSS treated plus GED; ASA, DSS treated plus 5-ASA.

