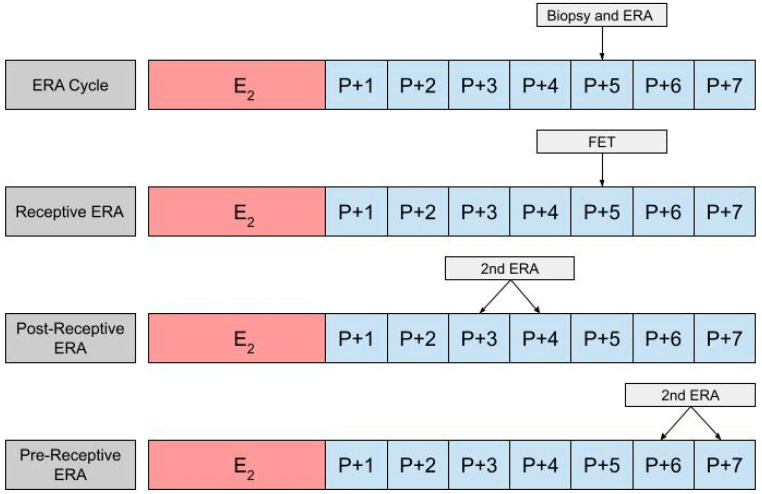
Figure 2.
The first row shows the timing of the biopsy and the ERA in a cycle. The subsequent row shows the timing of the frozen embryo transfer (FET) if the ERA indicates a receptive endometrium. The final two rows show the timing of the second ERA if the result of the initial ERA is post-receptive or pre-receptive, respectively.

