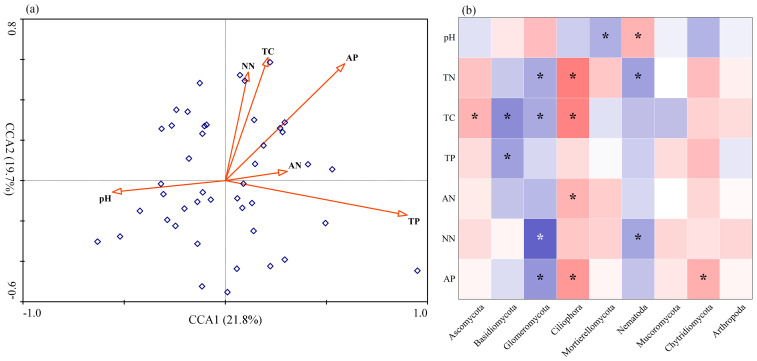
Figure 6.
(a) Canonical correspondence analysis (CCA) ordination plots depicting the relationships between the fungal community and selected soil properties. (b) A heatmap showing the correlation between dominant phyla and physicochemical variables. Red color indicated positive correlations, and blue color indicated negative correlations. * p < 0.05. Abbreviations: TN, total nitrogen; TC, total carbon; TP, total phosphorus; AN, ammonium nitrogen; NN, nitrate nitrogen; and AP, available phosphorus.

