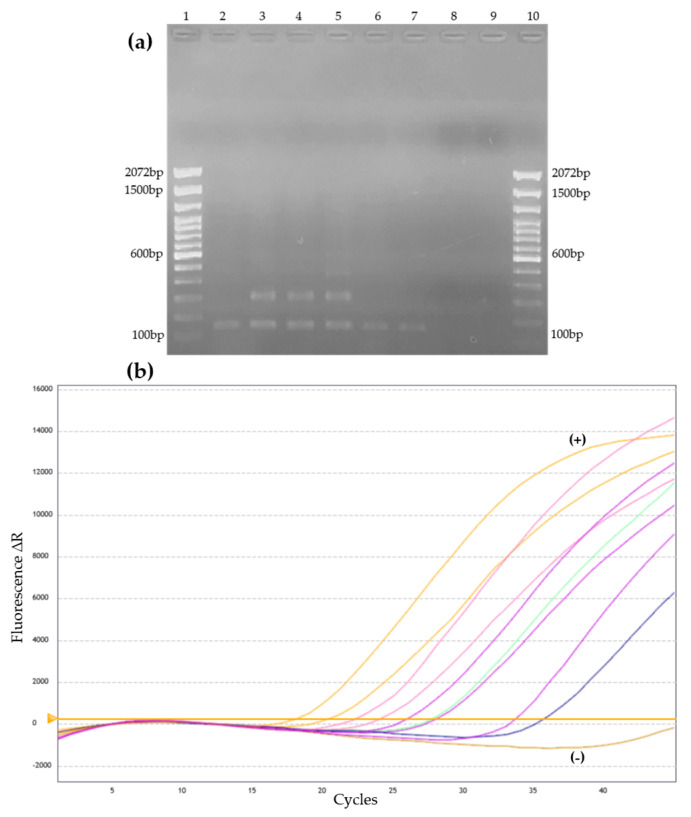
Figure 1.
Representative amplification profile of CSF samples in two DNA-based methods for Sporothrix spp. detection. (a) Nested PCR-Agarose gel with positive CSF samples, demonstrating 152 bp fragments compatible with Sporothrix spp. Values 1 and 10 = Molecular weight (100 pb Plus–Invitrogen), 2 to 6 = positive CSF samples, 7 = positive control of DNA extracted from Sporothrix brasiliensis culture (CBS 120339), 8 = PCR mix negative control, and 9 = PCR mix negative control with water addition. (b) Amplification curves of the qPCR observed in positive CSF samples using the CY3 fluorescence channel. Each colored curve represents a different sample. The yellow horizontal line represents the threshold of the reaction. +: positive control. −: negative control.

