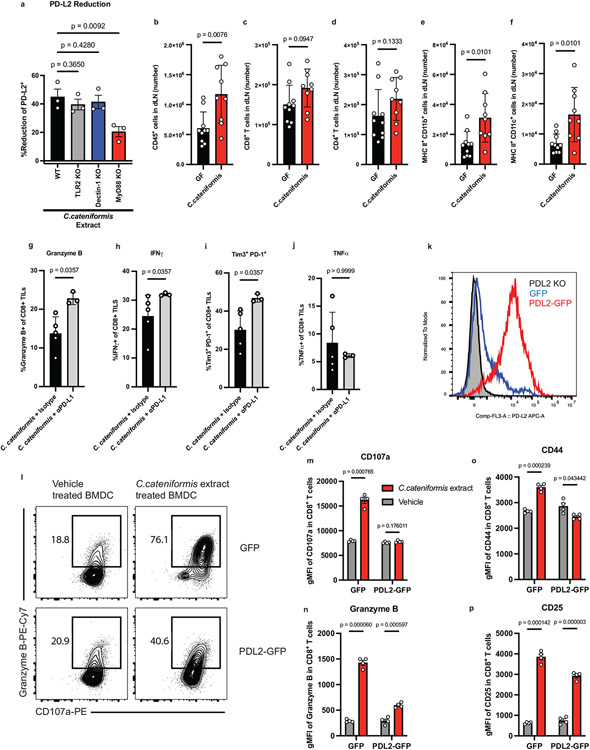
Extended Data Figure 7. C. cateniformis and its surface extracts impact immune function.
(a) BMDCs from WT, TLR2 KO, Dectin-1 KO, and MyD88 KO mice were treated with surface extracts isolated from C. cateniformis pellets. PD-L2 expression was measured by flow cytometry. Percent reduction (compared to vehicle treatment) of PD-L2 expressing dendritic cells is shown. Significance measured by Kruskal-Wallis test and P values compared to WT are indicated on graph. Error bars show mean and s.d., n = 3 wells of BMDCs per group. (b-f) Isotype treated-GF versus GF mice monocolonized with C. cateniformis one week prior to tumor implantation were sacrificed at day 13 p.i. and dLNs were analyzed by flow cytometry. Frequencies of (b) CD45+ cells, (c) CD8+ T cells (d) CD4+ T cells (e) MHCII+ CD11b+ cells and (f) MHCII+CD11c+ cells. (b-f) n= 10 mice for GF and n= 9 mice for C. cateniformis, significance measured by unpaired, two-tailed Mann-Whitney test and P values are indicated on graphs, error bars show mean and s.d. (g-j) GF mice were monocolonized one week prior to tumor implantation and treated with either isotype or anti-PD-L1. Mice were sacrificed at day 18 p.i. and tumors were harvested for analysis. Frequencies of CD8+ T cells expressing (g) Granzyme B (h) IFNγ (i) TIM-3 and PD-1 and (j) TNFα. For (g-j) n= 5 mice for isotype and n= 3 mice for anti-PD-L1, significance determined by unpaired, two-tailed Mann-Whitney tests and P values are indicated on graphs, error bars show mean and s.d. (k) Histograms of PD-L2 expression on BMDCs measured by flow cytometry. Red= BMDCs transduced with PD-L2 GPF lentivirus, Blue = BMDCs transduced with control GFP lentivirus, Gray = BMDCs from PD-L2 KO mice. (l-p) BMDCs transduced with GFP lentivirus (GFP) or lentivirus expressing GFP and PD-L2 (PD-L2-GFP) were treated with C. cateniformis extract 24 hours before co-culture with CD8+ T cells. Expression measured by flow cytometry. (l) Example of flow cytometry plots of Granzyme B and CD107a expression on CD8+ T cells. Quantification of mean fluorescence intensity of (m) CD107a and (n) Granzyme B expression on CD8+ T cells displayed in (l). Quantification of mean fluorescence intensity of (o) CD44 and (p) CD25 on CD8+ T cells. (m-p) Significance determined by unpaired, two-tailed t tests, with Welch correction and P values indicated on graph, n = 4 wells of BMDC-CD8+ T cell co-culture per group, error bars show mean and s.d.

