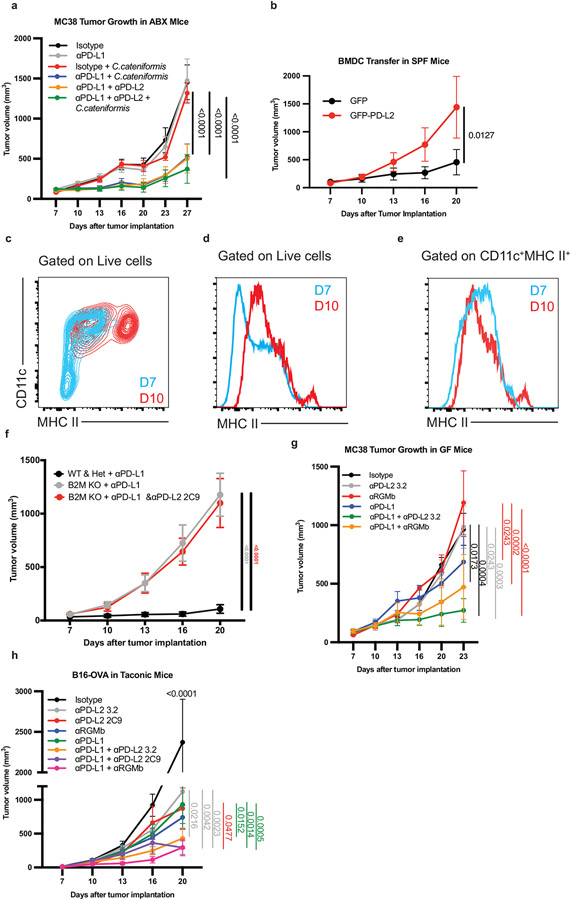
Extended Data Fig. 8. C. cateniformis treatment and PD-L2 blockade impacts anti-tumor immunity.
(a) Taconic mice were treated with broad spectrum antibiotics one week prior to tumor implantation. On days 7, 10, 13, 16 C. cateniformis or PBS was orally gavaged and antibodies were administered i.p. Significance between anti-PD-L1 + C. cateniformis treatment and the other groups at day 27 is shown. Significance measured by Two way ANOVA and Tukey’s multiple comparisons test, n = 10 mice per group, error bars show mean and s.e.m. (b) B16-OVA tumor growth in SPF mice that received GFP or PD-L2-GFP BMDCs at tumor site 3 days after tumor implantation. Significance indicated on graph and measured by 2way ANOVA and Sidak’s multiple comparisons test, n= 10 mice per group, error bars show mean and s.e.m. (c-e) BMDCs were cultured for 7 (blue) or 10 (red) days and MHCII expression was measured by flow cytometry. (c) Expression of CD11c and MHCII gated on live cells from BMDC culture. (d) Histogram of MHCII expression gate on live cells from BMDC culture. (e) Histogram of MHCII expression gated on CD11c+ MHCII+ cells. (f) Growth of MC38 tumor cells implanted subcutaneously in β2m−/− mice (B2M KO), β2m+/− (Het), and WT littermate controls. n= 5 mice per group for WT/het + anti-PD-L1 and B2M KO + anti-PD-L1 and n= 3 mice for B2M KO + anti-PD-L1 and anti-PD-L2. Significance indicated on graph measured by one-way ANOVA and Tukey’s multiple comparisons, error bars show mean and s.e.m. Tumor growth of (g) MC38 tumor cells in GF mice treated with Isotype (n= 5 mice), anti-PD-L1 (n= 5 mice), anti-PD-L2 clone 3.2 (n= 5 mice), anti-RGMb (n= 4 mice), anti-PD-L1 + anti-PD-L2 3.2 (n= 4 mice), or anti-PD-L1 + anti-RGMb (n= 5 mice) and (h) B16-OVA tumor cells in Taconic mice treated with Isotype (n= 5 mice), anti-PD-L1 (n= 10 mice), anti-PD-L2 clone 3.2 (n= 5 mice), anti-PD-L2 clone 2C9 (n= 5 mice), anti-RGMb (n= 5 mice), anti-PD-L1 + anti-PD-L2 3.2 (n= 10 mice), anti-PD-L1 + anti-PD-L2 2C9 (n= 10 mice), or anti-PD-L1 + anti-RGMb (n= 10 mice). (g,h) Significance measured by Two-way ANOVA and Tukey’s multiple comparisons, P values are shown on graph, error bars show mean and s.e.m.

