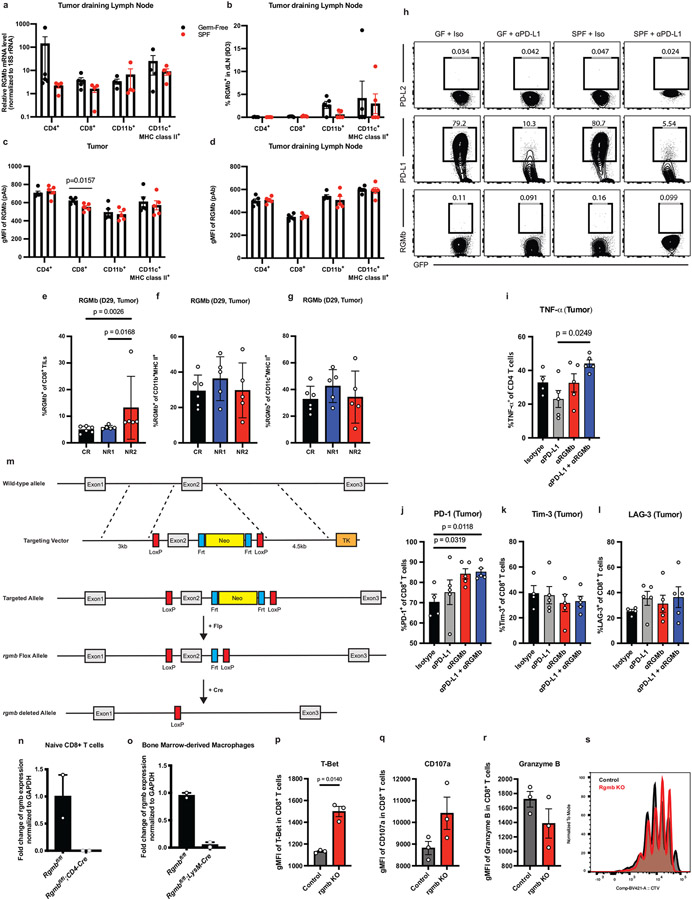
Extended Data Fig. 9. RGMb expression is modulated by the gut microbiota.
Tumor draining lymph nodes from GF and SPF mice implanted with MC38 tumor cells subcutaneously, as in Figure 1a, were analyzed on day 11 after implantation. (a) Relative mRNA expression of RGMb in tumor draining lymph nodes of indicated cells. The levels of rgmb transcripts were normalized to expression of an internal control gene 18S rRNA. N = 5 mice for GF and n= 4 mice for SPF and (b-d) cell surface expression of RGMb protein in CD4+ T cells, CD8+ T cells, CD11c+ MHCII+ and CD11b+ cells. (b) Frequencies of RGMb -expressing CD4+ T cells, CD8+ T cells, CD11c+ MHCII+ and CD11b+ cells were measured using 9D3 clone mAb in dLN, n = 5 mice per group. (c-d) Geometric Mean Fluorescent Intensity (gMFI) of RGMb was assessed in indicated populations from (c) tumor and (d) tumor draining lymph nodes using aRGMb polyclonal antibody, n = 5 mice per group. Significance measured by unpaired, two tailed Mann-Whitney test and significant p values indicated on graph, error bars show mean and s.d. (e-g) GF mice were colonized with stools from three patients who received anti-PD-1 therapy and responded or did not respond - Complete Responder (CR, n = 6) or Non-Responder 1(NR1, n = 5) or Non-Responder 2 (NR2, n = 5). The mice were injected subcutaneously with MC38 tumor cells and treated with rat IgG2b isotype control. Frequencies of RGMb-expressing tumor-infiltrating (e) CD8+ T cells, (f) CD11b+MHC II+ cells, and (g) CD11c+MHC II+ cells were examined on post-implantation day 29. Significance measured by non-parametric one-way ANOVA with Dunn’s multiple comparisons test and significant p values indicated on graph. Error bars show mean and s.d. (h) MC38 tumor cells expressing GFP were implanted in GF or SPF mice. The mice were treated with two doses of isotype control or anti-PD-L1 one week after tumor implantation, and tumors were harvested 13 days after tumor implantation. MC38-GFP cells were isolated and examined to measure PD-L2 (Upper), PD-L1 (Middle), and RGMb (Lower) expression by flow cytometry. Representative of 5 mice per group. (i) GF mice were implanted with MC38 tumor cells subcutaneously and treated with indicated antibodies as in Figure 1a. Tumor-infiltrating CD4+ T cells were isolated on day 11 after tumor implantation and stimulated with PMA/Ionomycin for 5 hours. Frequencies of TNF-α producing cells among CD4+ T cell population were measured by intracellular staining and flow cytometry. N= 4 mice for isotype and n = 5 mice for anti-PD-L1, anti-RGMb, and anti-PD-L1 + anti-RGMb groups. Significance measured by non-parametric one-way ANOVA with Dunn’s multiple comparisons and indicated on graph. Error bars show mean and s.d. (j-l) GF mice were implanted with MC38 tumor cells subcutaneously and treated with indicated antibodies as in Figure 1a. Cells in tumor and tumor draining lymph node were analyzed on day 11 after tumor implantation. Frequencies of tumor infiltrating CD8+ T cells expressing (j) PD-1 (k) TIM-3 and (l) LAG-3. N= 4 mice for isotype and n = 5 mice for anti-PD-L1, anti-RGMb, anti-PD-L1 + anti-RGMb groups.
Significance measured by non-parametric one-way ANOVA with Dunn’s multiple comparisons and significant p values indicated on graphs. Error bars show mean and s.d.
(m) Strategy to generate RGMb conditional knockout mice (n) Validation of CD4-Cre mediated deletion of RGMb in peripheral naïve CD8 T cells by qPCR (o) Validation of LysM-Cre mediated deletion of RGMb in bone marrow derived macrophages by qPCR, n = 2 mice per group. Error bars show mean and s.d. (p-s) WT or RGMb KO CD8+ T-cells were co-cultured with WT BMDCs. CD8+ T cells were analyzed by flow cytometry for (p) Mean Fluorescence Intensity (MFI) of T-Bet (q) MFI of CD107a (r) MFI of Granzyme B and (s) proliferation measured by Cell Trace Violet. N=3 per group. Representative experiment of 3 experiments. Significance determined by unpaired Mann-Whitney test and significant p values indicated on graphs. Error bars show mean and s.d.

