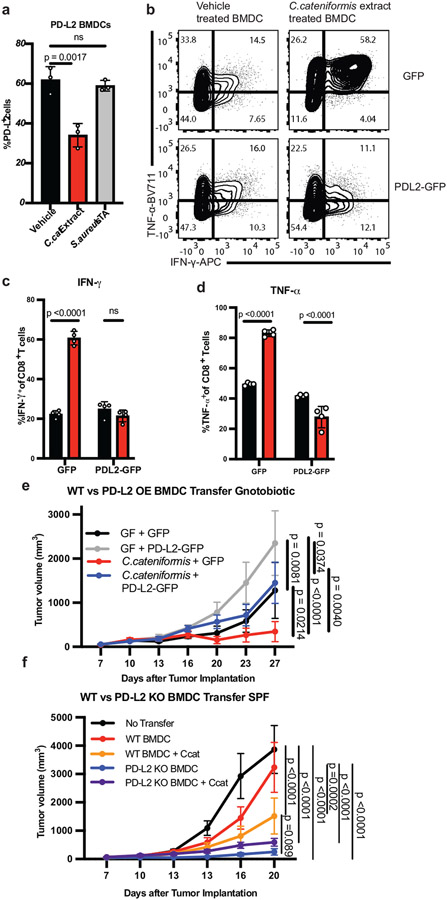
Figure 3. C. cateniformis promotes anti-tumor immunity via PD-L2 downregulation.
(a) % PD-L2 expressing BMDCs treated with vehicle, 10 μg/ml surface extracts from C. cateniformis (C. cateniformis extract), or 10 μg/ml lipoteichoic acid (LTA) from Staphylococcus aureus, as a control for Gram-positive surface molecules, n = 3 wells per group, representative experiment of 2 experiments, significance measured by one-way ANOVA with Tukey’s multiple comparisons test, error bars show mean and s.d. (b-d) BMDCs transduced with GFP lentivirus (GFP) or lentivirus expressing GFP and PD-L2 (PD-L2-GFP) were treated with C. cateniformis extract 24 hours before co-culture with CD8+ T cells. Expression measured by flow cytometry. (b) Example of flow cytometry plots of IFNγ and TNFα expression by CD8+ T cells. Quantification of % of (c) IFNγ+ and (d) TNFα+ CD8+ T cells displayed (b). (c-d) Significance measured by two-way ANOVA with Sidak’s multiple comparisons test, significant p values shown, n = 4 wells per group, error bars show mean and s.d. (e) B16-OVA tumor growth in GF and C. cateniformis monocolonized mice injected with GFP or GFP-PD-L2 (PD-L2 overexpression) BMDCs at tumor site 3 days after tumor implantation. N = 9 mice for GF + GFP and C. cateniformis + GFP-PD-L2, n = 8 mice for GF + GFP-PD-L2, n = 10 mice for C. cateniformis + GFP (f) B16-OVA tumor growth in SPF mice injected at tumor site with WT or PD-L2 KO BMDCs treated with or without C. cateniformis extract. n=10 mice per group. (e-f) Significance measured by Tukey’s multiple comparisons test, significant p values indicated, error bars show mean and s.e.m.

