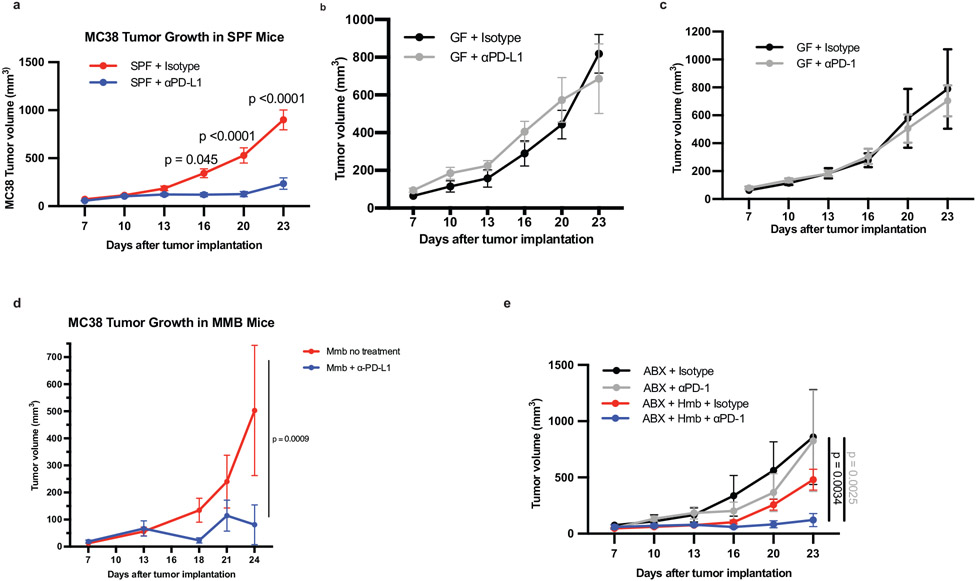
Extended Data Fig. 1. SPF, MMB, and HMB promote anti-tumor responses to PD-1/PD-L1 blockade.
MC38 tumor growth with or without anti-PD-L1 in (a) Taconic SPF n= 10 mice per group. Significance indicated on graph and measured by Two Way ANOVA and Sidak’s multiple comparisons test or (b) GF n = 5 mice per group, performed at the same time as (a), representative experiment of 14 individual experiments. MC38 tumor cells were implanted subcutaneously in (c) GF mice n=4 mice for isotype group and n=5 mice for anti-PD-1 group. (d) GF mice were orally gavaged with MMB one week before implantation of MC38 tumor cells. N=3 mice for no treatment group and n=6 mice for anti-PD-L1 group. Significance indicated on graph and measured by Two Way ANOVA and Sidak’s multiple comparisons test. (e) MC38 tumor cells were implanted subcutaneously in ABX or ABX/HMB mice and treated with anti-PD-1 according to Figure 1a, and monitored for tumor growth. N=3 mice for ABX + isotype group and n= 4 mice for ABX + anti-PD-1, ABX/HMB + Isotype, and ABX/HMB + anti-PD-1 groups. Significance indicated on graph and measured by Two-Way ANOVA and Tukey’s multiple comparisons test. (a-e) Error bars show mean and s.e.m.

