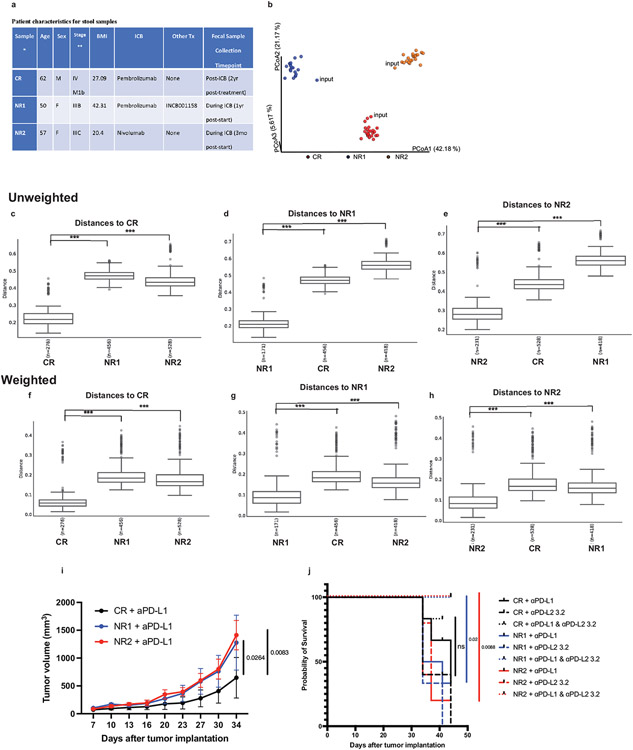
Extended Data Fig. 4. 16S sequencing of fecal samples, tumor growth, and survival of mice colonized with melanoma patient stool.
(a) Patient characteristics for stool samples. *Samples were characterized as complete responder (CR) or non-responder (NR) based on RECIST 1.1 response criteria. Mean age is 56.3 years, mean BMI is 29.9 kg/m2. **Stage at start of ICB treatment. (b-h) Bacterial community configuration and distances in fecal samples collected from three different sets of mice colonized with melanoma patient stool: complete responder (CR), Non-responder 1 (NR1) and Non-responder 2 (NR2) as well as input. (b) Principal coordinates analysis (PCoA) of unweighted UniFrac distance measurements based on the 16S sequencing analysis of the composition of bacterial communities at 7 day after gavage. Each colored circle represented a fecal community sampled from a mouse belonging to the indicated donor group or input gavage sample. Pairwise unweighted UniFrac distances of the composition of bacterial communities in fecal samples within (c) CR and across NR1 and NR2 groups compared to CR (d) NR1 and across CR and NR2 groups compared to NR1 and (e) NR2 and across CR and NR1 groups compared to NR2. Pairwise weighted UniFrac distances of the composition of bacterial communities in fecal samples within (f) CR and across NR1 and NR2 groups compared to CR (g) NR1 and across CR and NR2 groups compared to NR1 and (h) NR2 and across CR and NR1 groups compared to NR2. n= number of pairwise distances calculated between all samples in each group compared to the comparator group. *** q-values=0.001, PERMANOVA. Minima, maxima, center, bounds, and percentiles of boxplots shown in source data. GF mice were colonized with stool from Responder (R) or Non-Responder (NR) melanoma patients treated with anti-PD-1, implanted with MC38 tumors, and given anti-PD-L1, anti-PD-L2 or anti-PD-L1 plus anti-PD-L2 mAbs. (i) Tumor growth in mice treated with anti-PD-L1 monotherapy. N=6 mice for CR and NR1 groups and n= 5 mice for NR2 group. Significance determined by 2 way ANOVA and Tukey’s multiple comparisons test and significant p values are indicated on graph. Error bars show standard error of the mean. (j) Survival of mice given anti-PD-L1, anti-PD-L2 or anti-PD-L1 plus anti-PD-L2 mAbs. Survival defined as number of live mice with tumors <2 cm3 or <50% ulcerated. N= 6 for CR + anti-PD-L1, CR+ anti-PD-L1 + anti-PD-L2, NR1 + anti-PD-L1, NR1 + anti-PD-L1 and anti-PD-L2, NR2 + anti-PD-L1 and anti-PD-L2, n=5 for CR + anti-PD-L2, NR2 anti-PD-L1, NR2 anti-PD-L2, n=3 for NR1 + anti-PD-L2. Significance of anti-PD-L1 monotherapy versus combination therapy for each group of mice shown and significance indicated on graph.

