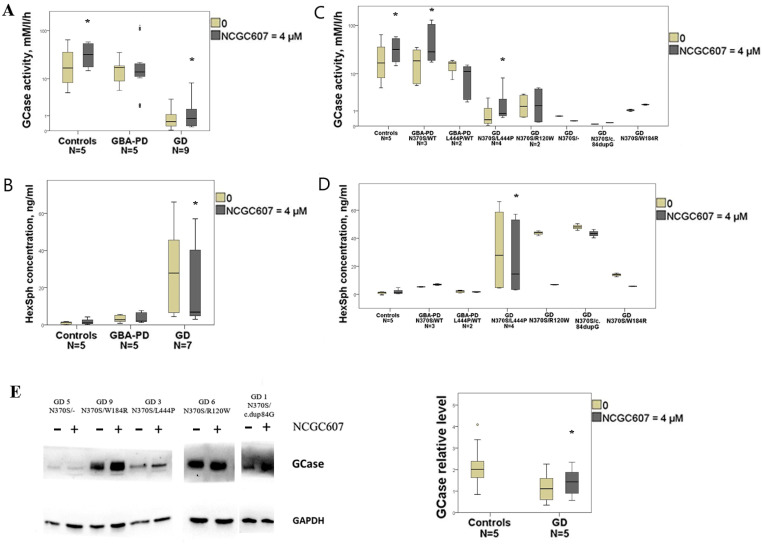
Figure 3.
Evaluation of the NCGC607 effect (4 µM, 4 days) on GCase activity and protein levels, HexSph concentration in cultured macrophages from GD, GBA-PD patients and controls. (A) GCase activity (log scale) and (B) HexSph concentration in cultured macrophages from GD, GBA-PD patients and controls. (C) GCase activity (log scale) and (D) HexSph concentration in GD and GBA-PD macrophages depending on the type of GBA1 mutations. (E) Western blot analysis of GCase levels in GD macrophages. * p-value < 0.05 compared to untreated cells.

