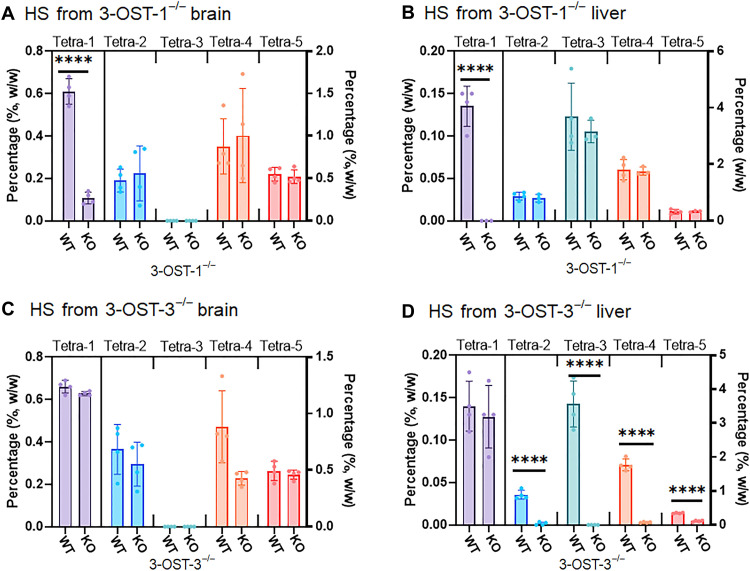
Fig. 5. Levels of 3-O-sulfated tetrasaccharides in HS from wild-type, 3-OST-1−/−, and 3-OST-3−/− mice.
(A) shows the composition of 3-O-sulfated tetrasaccharides in brain HS from 3-OST-1−/− mice. WT, wild type; KO, knockout. (B) shows the composition of 3-O-sulfated tetrasaccharides in liver HS from 3-OST-1−/− mice. (C) shows the composition of 3-O-sulfated tetrasaccharides in brain HS from 3-OST-3−/− mice. (D) shows the composition of 3-O-sulfated tetrasaccharides in liver HS from 3-OST-3−/− mice. Data are presented as average (n = 3 or 4) ± SD. The P value was determined by two-tailed unpaired t test, ****P < 0.0001. The complete dataset for the analysis is shown in tables S14 and S15.

