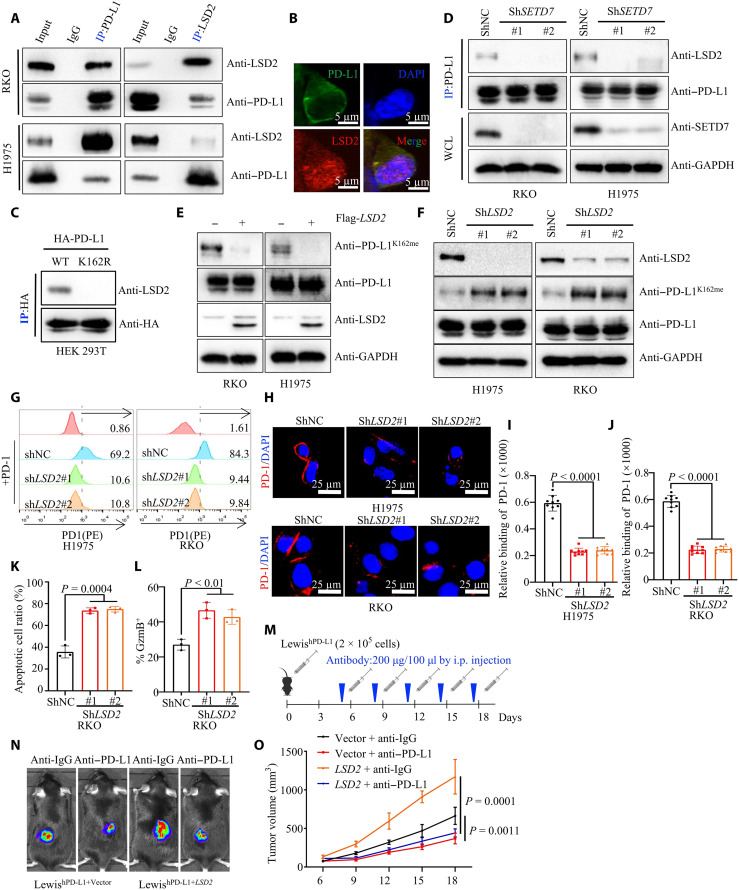
Fig. 6. LSD2 demethylates PD-L1 K162 methylation.
(A) WCE were collected for IP with PD-L1 or LSD2 antibody, followed by IB analysis with (top) or without (bottom) PNGase F reaction. (B) Fixed RKO cells stained with PD-L1 and LSD2 antibodies, followed by IF assays. (C) Transfecting HA–PD-L1 WT or HA–PD-L1 K162R plasmids into HEK293T cells, WCE were collected for IP assays with HA antibody, followed by IB analysis. (D) IP and IB analysis measuring LSD-2/PD-L1 interaction in shNC or shSETD7 cells. (E) IP and IB analysis measuring PD-1K162me level in vector or LSD2 cells. (F) WCE were collected from shNC or shLSD2 cells, followed by IB analysis. (G) Flow cytometry measuring PD-L1/PD-1 binding on the membrane of shNC or shLSD2 cells. (H to J) Representative images (H) for confocal image showing bound PD-1/Fc fusion proteins on the membrane of shNC or shLSD2 cells. Statistical analysis was shown (I and J); n = 9, P < 0.0001 (I), P < 0.0001 (J). (K) T cell–mediated tumor cell killing assay in indicated RKO cells; the quantitative ratio of dead cells was shown; P = 0.0004; n = 3, P = 0.0004. (L) Activated T cells cocultured with indicated RKO cells; measuring GZMB of T cell by flow cytometry. Statistical analysis was shown; n = 3, P < 0.01. (M to O) In vitro xenograft tumor assays using vector or LSD2 LewishWT cells in C57BL/6hPD1 mice. Anti–PD-L1 antibody was used at indicated time. The treatment protocol was summarized (M). The representative bioluminescence images (N) and tumor growth rate (O) were shown; n = 5, P = 0.0011 or = 0.0001. All IBs are performed three times, independently, with similar results. Error bars are means ± SD. Statistical significance was assessed using Student’s two-tailed t test.

