
FIGURE 2.
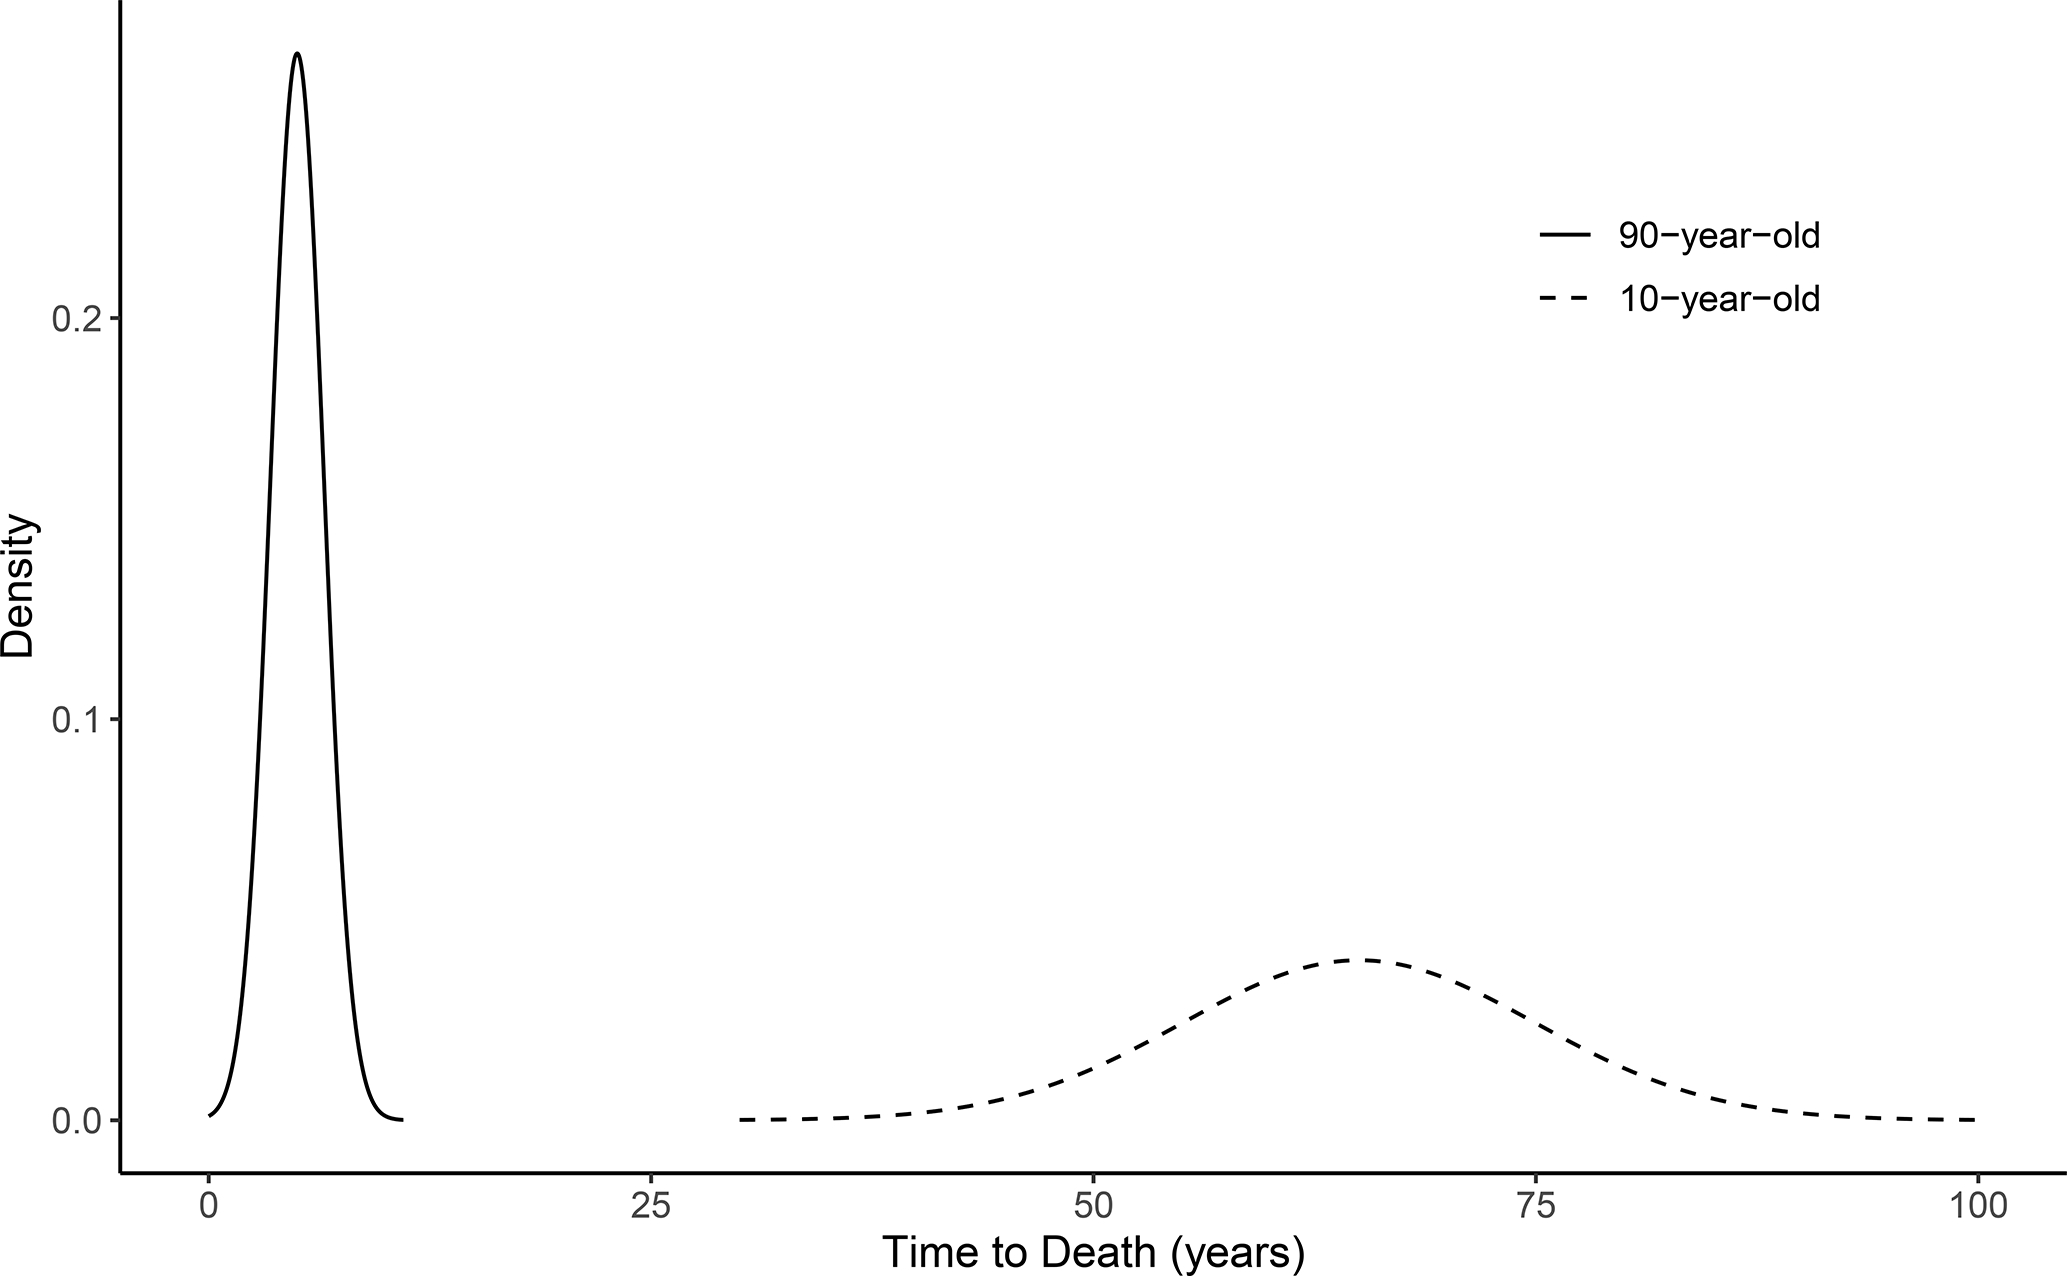
A hypothetical distribution of time-to-death outcomes within a population of 10-year-olds and 90-year-olds. The distribution is highly-clustered, and the differences in underlying mortality risks are large across the age groups and small within each age group. The C-Index calculation for a survival model with age as a predictor would involve many comparisons of patients with the same age and very similar underlying risks.