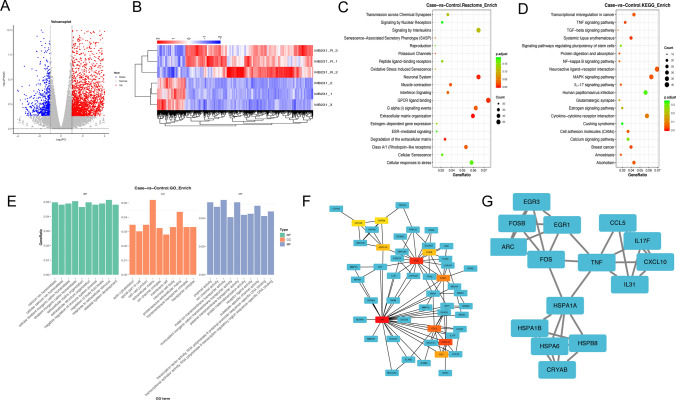
Fig. 4.
Analysis of RNA-seq data of TNBC cells treated with hyperthermia. A–B Scatterplot and heat map of DEGs between control and hyperthermia groups. Red color represents up-regulated genes, blue represents down-regulated genes. C The Reactome pathway enrichment analysis of DEGs (|log2FC|>1 and P value < 0.05). D The KEGG pathway enrichment analysis of DEGs (|log2FC|>1 and P value < 0.05). E The GO enrichment analysis of molecular function, biological process and cellular component in DEGs (|log2FC|>1 and P value < 0.05). F The PPI network was constructed by DEGs (FC > 2 and P value < 0.05). G The most significant module of PPI network

