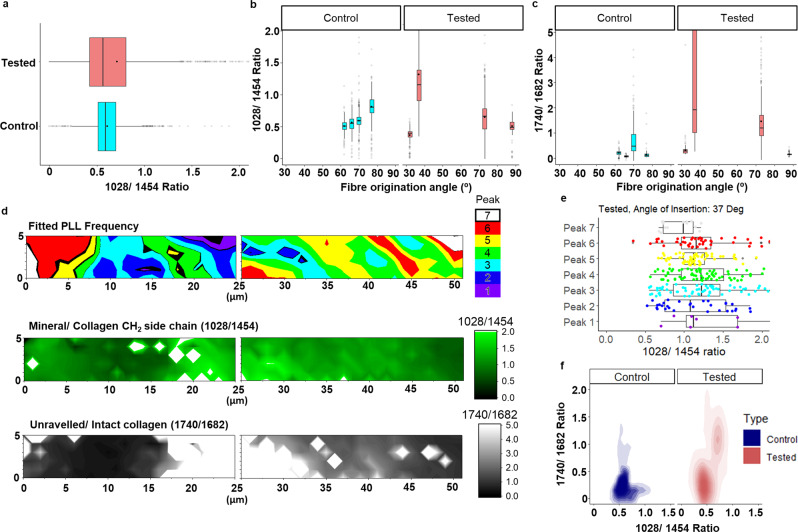
Fig. 4. Localisation of fatigue-induced collagen unravelling in regions with higher mineralisation in cadaver sample I.
a Comparison of the boxplot of the mineral/collagen CH2 side chain (1028/1454) ratio between the control and tested ACL. b Boxplot of the mineral/collagen side chain ratio across various locations represented by the local bulk fibre angle along the tidemark (left) between control and tested. c Boxplot of the unravelled/intact collagen ratio across various locations represented by the local fibre origination angle along the tidemark between control and tested. d Fitted PLL Frequency, mineral/collagen CH2 side chain ratio and unravelled/intact collagen ratio map collected up to 50 µm from the tidemark in the ligament of the tested ACL. e Boxplot of mineral/collagen side chain ratio in each of the fitted peaks demonstrating an increasing mineralisation with increasing domain compliance in the tested ACL. f Comparison of overall 2D density plot of the mineral/collagen CH2 side chain ratio against unravelled/intact collagen ratio between the control and tested ACL showing overall increase in collagen unravelling with increasing mineralisation post testing. Boxplot legend: solid dot = mean, solid line = median, whiskers = 5–95% of data, box = 1st–3rd interquartile range, Translucent dot = outliers, n = 2 human cadaver ACLs.

