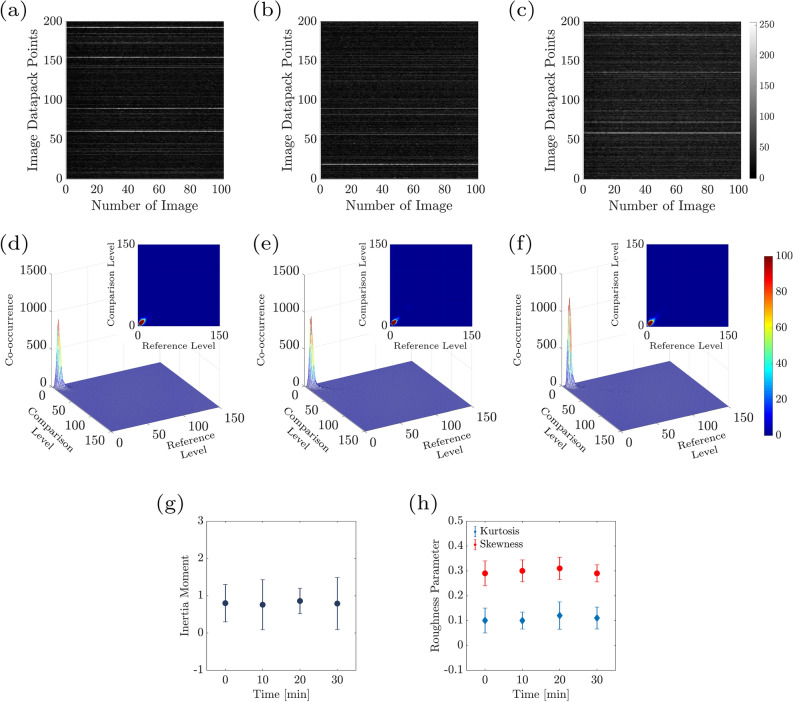
Figure 9.
Time history speckle pattern (THSP), formed by tracking 200 random points throughout a collection of 100 speckle patterns, of the sample at (a) , (b) , and (c) after the experiment starts. (d–f) 3D plot and 2D map of COM matrix associated with the THSP matrices of controlling experiment (a–c) every 10 min after the experiment starts. Reference level and comparison level show intensity levels of i and j in Eq. (1), respectively. (g) Average inetia moment over the THSPs associated with the sample in controlling experiment as a function of time. (h) Average kurtosis and skewness of 100 speckle pattern of the controlling experiment as a function of time.

