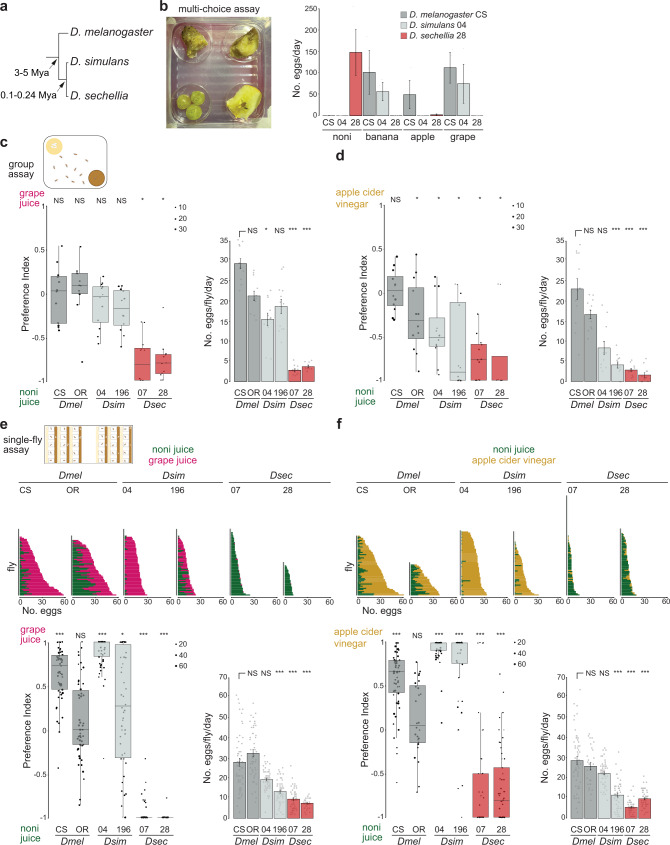
Fig. 1. D. sechellia displays robust, species-specific preference for oviposition on noni substrates.
a Phylogeny of the drosophilid species studied in this work. Mya, million years ago. b Fruit multi-choice oviposition preference assay. Left: image of the assay with noni, banana, apple and grape (clockwise from top left) in the arena. Right: quantification of the number of eggs laid per day; N = 3 assays/species, using 50 flies each for a duration of 3 days. Strains used: D. melanogaster Canton-S (CS), D. simulans 14021-0251.004 (04) and D. sechellia 14021-0248.28 (28); see Supplementary Table 1 for details of all strains used in this work. In these and all other bar plots, mean values ± standard error of the mean (SEM) are shown, overlaid with individual data points. All raw behavioral data are provided in the Source Data files. c Group oviposition preference assays for noni juice versus grape juice (see Supplementary Table 2 for sources of all chemical stimuli) in 0.67% agarose using two strains each of wild-type D. melanogaster (Dmel: CS and Oregon R (OR)) (dark grey bars, here and elsewhere), D. simulans (Dsim: 04 and 14021-0251.196 (196)) (light grey bars, here and elsewhere) and D. sechellia (Dsec: 14021-0248.07 (07) and 28) (red bars, here and elsewhere). Left: box plots of oviposition preference index. In these and all other box plots, the middle line represents the median, and the lower and upper hinges indicate the first and third quartiles, respectively. Individual data points are overlaid on the box plots; point size is scaled by the total number of eggs laid in an assay (key at top right of the plot); data beyond the whiskers are considered outliers. For these and other box plots, statistically-significant differences from 0 (no preference) are indicated: ***P < 0.001; **P < 0.01; *P < 0.05; NS (not significant) P > 0.05 (Wilcoxon test with Bonferroni correction for multiple comparisons); N = 12 (representing 4 group assays, each scored on 3 successive days with fresh oviposition plates each day). Exact P values for the statistical comparisons are provided in the Source Data files. Right: bar plots of egg-laying rate per fly per day in these assays. Statistically-significant differences from the D. melanogaster CS strain are indicated: ***P < 0.001; **P < 0.01; *P < 0.05; NS P > 0.05 (Kruskal-Wallis rank sum test with Nemenyi post-hoc test). d Group oviposition preference assays, as in c, for noni juice versus apple cider vinegar; N = 12, as in c. e Single-fly oviposition preference assays for noni juice versus grape juice in agarose for the same strains as in c. Top: total number of eggs laid in each substrate by each female. Bottom left: oviposition preference index. Statistically-significant differences from 0 (no preference) are indicated as in c; N = 30–60 flies across 1-2 technical replicates (precise N values for these and all following assays are provided in the Source Data files). Bottom right: egg-laying rate, presented as in c. f Single-fly oviposition preference assays, as in e, for noni juice versus apple cider vinegar; N = 30–90 flies across 1–3 technical replicates.

