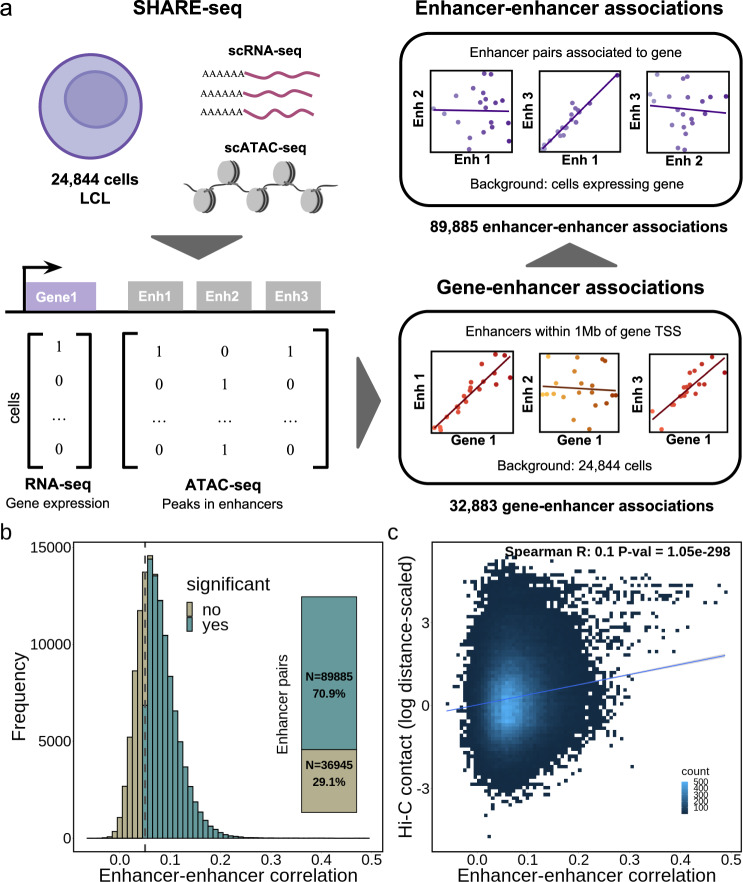
Fig. 1. Enhancer-enhancer co-activity overview.
a Scheme of the approach used to determine gene-enhancer associations and enhancer-enhancer associations from SHARE-seq data. Enhancer-enhancer associations were calculated for pairs of enhancers significantly associated with genes; b Enhancer-enhancer association correlation distribution (N = 126,830). The inner plot denotes the percentage of significant associations (green colour, FDR < 5% and absolute correlation > 0.05); c Hi-C contacts (log distance-scaled, 5 kb resolution) per enhancer-enhancer correlation value (N = 126,830).

