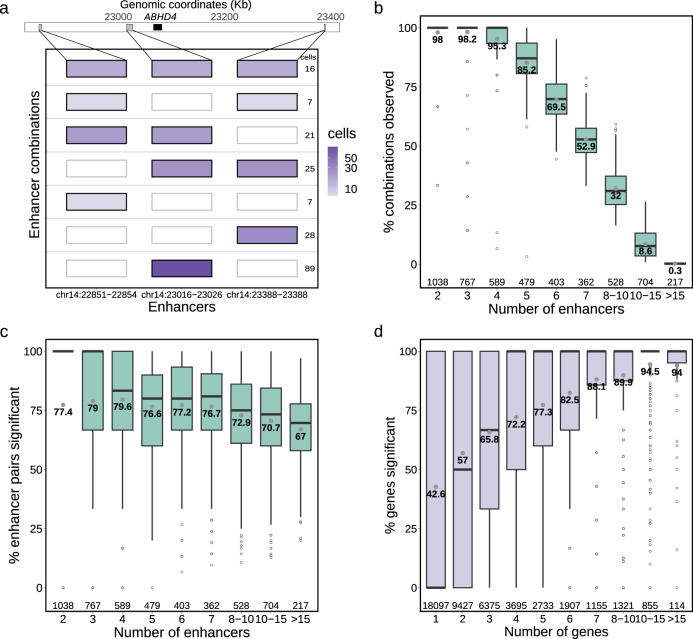
Fig. 2. Frequency of co-active enhancers.
a Enhancer combinations observed in single cells for the ABHD4 example gene with three associated enhancers. All seven possible combinations between three enhancers are represented (y-axis), with colour intensity mapped to the number of cells in which the combinations are observed; b Percentage of enhancer combinations observed in at least one cell (y-axis) per number of enhancers significantly associated with the gene (x-axis). Grey dots and nearby values represent the mean. Sample sizes for each category are provided in the bottom of the plot; c Percentage of significantly associated enhancer-enhancer pairs (y-axis) per number of enhancers significantly associated with the gene (x-axis); d Percentage of genes in which enhancer-enhancer pairs are significantly associated (y-axis) per number of genes in which they were tested (x-axis). A total of 45,679 distinct enhancer-enhancer pairs were analysed. For all boxplots, the length of the box corresponds to the IQR with the centre line corresponding to the median, the upper and lower whiskers represent the largest or lowest value no further than 1.5 × IQR from the third and first quartile, respectively.

