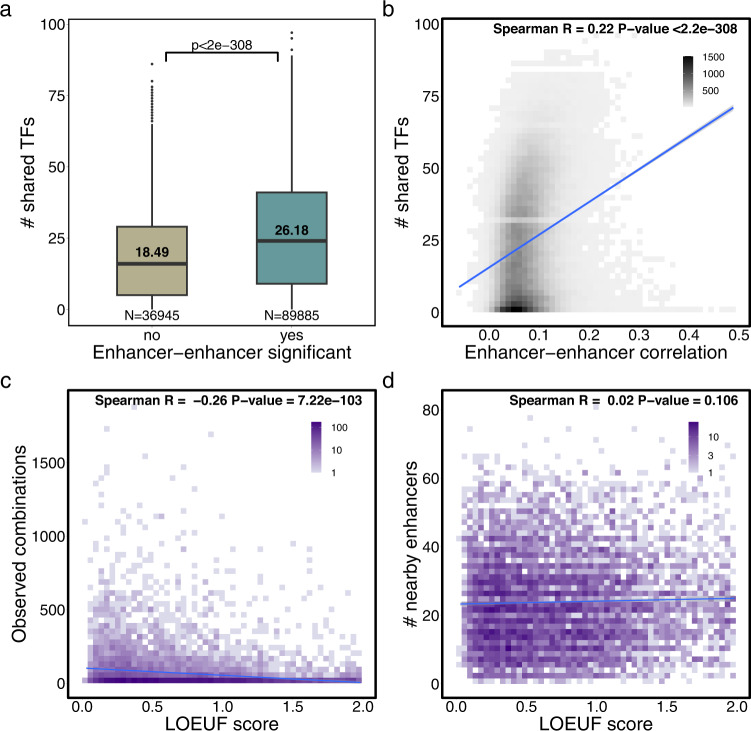
Fig. 3. Features of enhancer co-activity.
a Number of distinct TFs with binding sites (ReMap data) in both enhancers of an enhancer-enhancer pair (shared TFs), depending on their association significance. Two-tailed Wilcoxon test p-value < 2.2e−308. The length of the box corresponds to the IQR with the centre line corresponding to the median, the upper and lower whiskers represent the largest or lowest value no further than 1.5 × IQR from the third and first quartile, respectively. Values above the median line represent the mean; b Number of shared TFs per enhancer-enhancer correlation coefficient (N = 126,830); c Number of enhancer combinations observed in at least one cell (y-axis) per gene LOEUF score (x-axis) (N = 6895); d Number of enhancers within 1 Mb of the gene TSS (regardless of gene-enhancer association significance) per gene LOEUF score (N = 6895). Fit lines represent a linear regression model.

