Fig. 3.
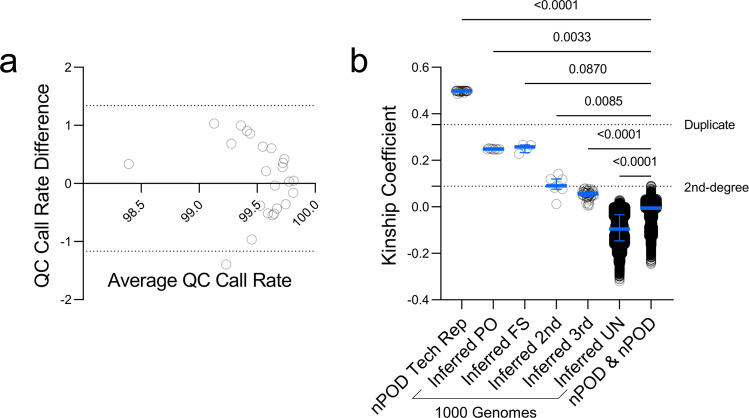
UFDIchip data are highly replicable and nPOD donors are unrelated. (a) Bland-Altman plot showing average vs. difference in QC call rates for n = 24 technical replicates. Horizontal dashed lines indicate 95% limits of agreement. (b) Relatedness analysis was performed using KING software30 for genotyping data from 372 nPOD donors, 24 of which were run in technical replicate, along with 2,504 1000 Genomes phase 3 cohort32 subjects, known to include some closely related individuals. Relatedness assessed via estimated kinship coefficients. Kinship coefficients from nPOD donor pairs were compared to those from 1000 Genomes subject pairs including inferred parent-offspring (PO), first-degree siblings (FS), second-degree relatives (2nd), third-degree relatives (3rd), and unrelated (UN). Bars represent median and interquartile range (IQR). Horizontal dashed lines indicate lower cutoffs for duplicate samples (kinship coefficient = 0.354) and second-degree relatives (kinship coefficient = 0.0884). Kruskal-Wallis test with Dunn’s multiple comparisons test for nPOD & nPOD (different subjects) versus all inferred 1000 Genomes subject relationship types or nPOD technical replicates.

