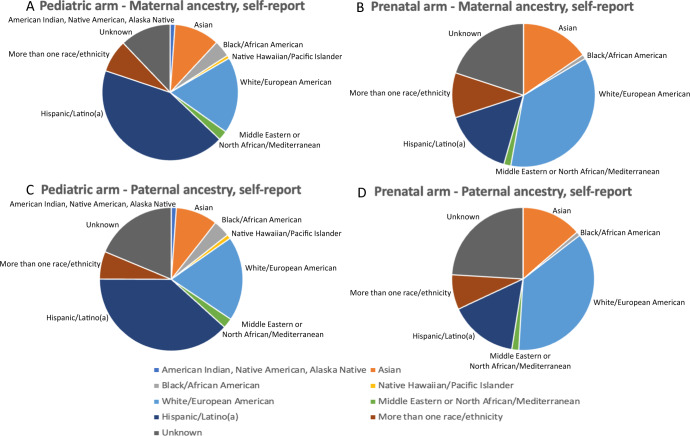
Fig. 1. Distribution of ancestry in 845 patients enrolled in the Program in Prenatal and Prenatal Genomic Sequencing (P3EGS) study.
Each chart shows the distribution of ancestry according to the arm of the study (Pediatric and Prenatal) and the sex of the participant. Ancestries depicted are American Indian, Native American (blue), Alaskan Native (Asian (orange), White/European (light blue), Middle Eastern/North African (green), Hispanic/Latino or Latina (dark blue), More than one race/ethnicity (brown), Unknown, none of the above (gray). A Pediatric patients, maternal ancestry. B Pediatric patients, paternal ancestry. C Prenatal patients, maternal ancestry. D Prenatal patients, paternal ancestry.

