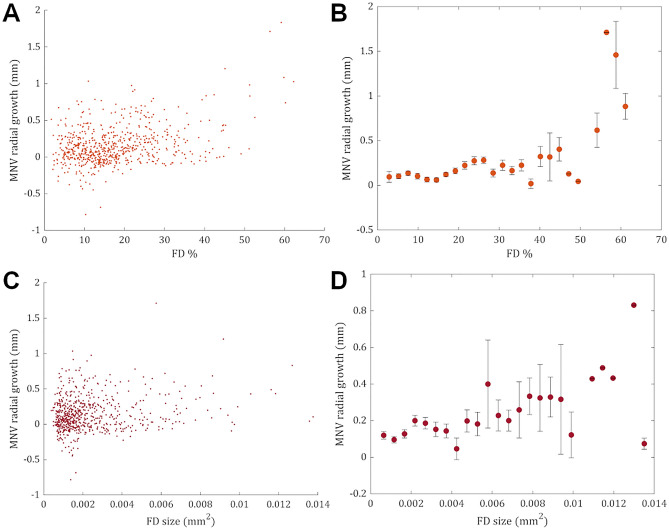
Figure 1.
Data plots resulting from the analysis of the entire cohort. (A, C) Data plots resulting from the analysis of the entire cohort show a positive monotonic tendency between FD features (average size and percentage) and neovascular growth patterns, i.e., neovascular growth and the value of FD features moved in the same direction but not necessarily at a constant rate. (B, D) A monotonic relationship is better appreciated after binning FD features into uniform classes and plotting against the average neovascular growth (mean ± standard error of the mean) for each interval.

