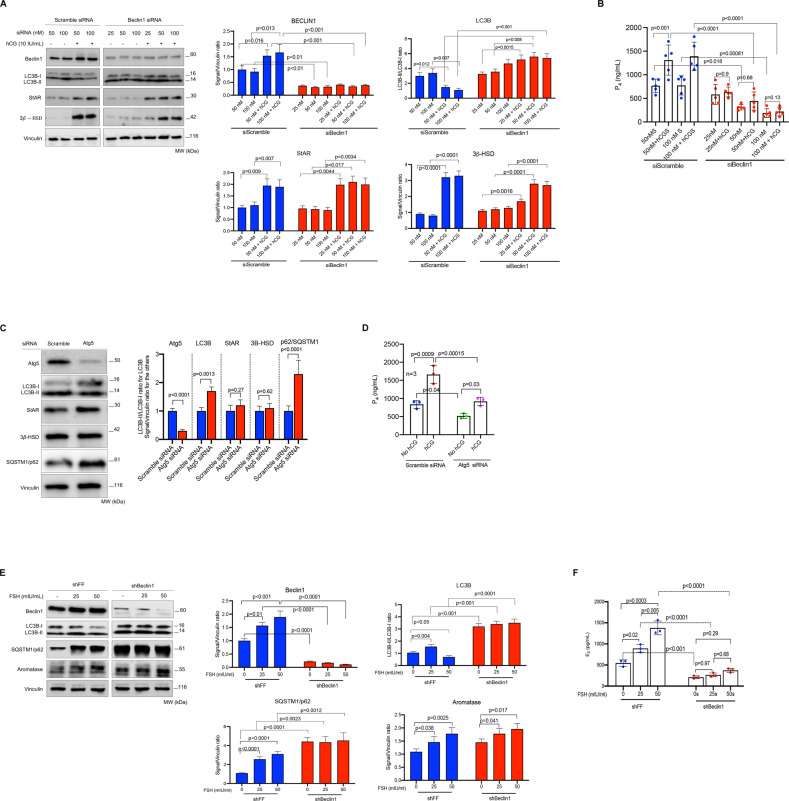
Fig. 3. Genetic interruption of autophagy via siRNA and shRNA significantly reduces progesterone and estrogen production in granulosa cells.
A Representative blots for indicated proteins of scramble (control) siRNA, Beclin1 siRNA and hCG-treated luteinized granulosa cells. Densitometric quantification is indicated to the right of the blots. Mean ± SD, N = 5 biological replicates analyzed using one-way ANOVA, with Tukey’s test for multiple comparisons. B Representative graphic bar indicates progesterone (P4) production of the luteinized granulosa cells transfected with control siRNA, Beclin1 siRNA and treated with hCG (10 IU/ml). Mean ± SD, N = 5 biological replicates analyzed using one-way ANOVA, with Tukey’s test for multiple comparisons. C Representative blots for indicated proteins of control (scramble) siRNA and Atg5 siRNA-treated luteinized granulosa cells. Densitometric quantification is indicated to the right of the blots. Mean ± SD, N = 3 biological replicates analyzed using one-way ANOVA, with Tukey’s test for multiple comparisons. D Representative graphic bars indicate progesterone (P4) production of the luteinized granulosa cells transfected with control siRNA, Atg5 siRNA and treated with hCG (10 IU/ml). Mean ± SD, N = 3 biological replicates analyzed using one-way ANOVA, with Tukey’s test for multiple comparisons. E Representative blots for indicated proteins of control (FF) shRNA, Beclin1 shRNA and FSH-treated non-luteinized granulosa cells (HGrC1). Densitometric quantification is indicated to the right of the blots. Mean ± SD, N = 3 biological replicates analyzed using one-way ANOVA, with Tukey’s test for multiple comparisons. F Representative graphic bars indicate estradiol (E2) production of the HGrC1 cells transfected with control shRNA, Beclin1 shRNA and treated with FSH at indicated concentrations. Mean ± SD, N = 3 replicates were analyzed using one-way ANOVA, with Tukey’s test for multiple comparisons.

