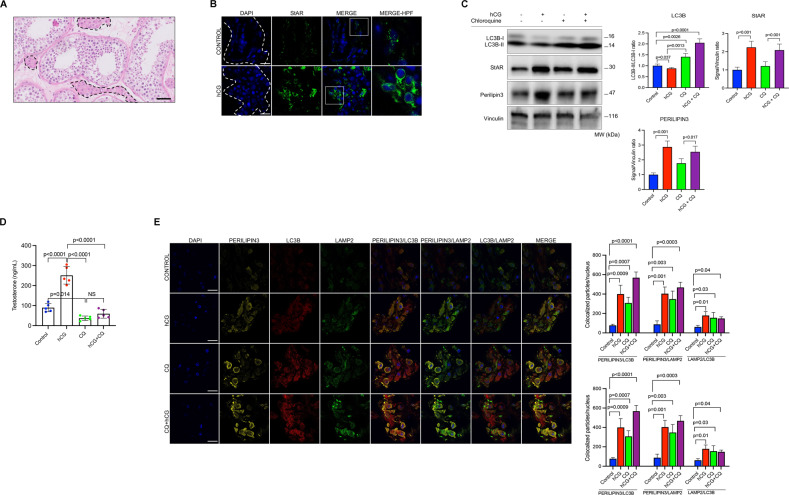
Fig. 6. Pharmacological inhibition of autophagy with chloroquine (CQ) impairs testosterone production in testicular tissue samples.
A Representative histological section of testicular tissue sample after hematoxylin-eosin staining. Dotted areas show the steroidogenic Leydig cells interspersed between seminiferous tubules with Sertoli cells and germ cells. Scale bar represents 50 μm. B Confocal images of the cryosections of the testicular tissue samples stained for StAR (green) before and after treatment with hCG (10 IU/ml). Nuclei stained with DAPI. Scale bars represent 20 μm. C Representative blots for indicated proteins before and after treatment with hCG (10 IU/ml) w/wo CQ (60 μM). Densitometric quantification is indicated to the right of the blots. Mean ± SD, N = 5 biological replicates analyzed using one-way ANOVA, with Tukey’s test for multiple comparisons. D Testosterone (T) production of the samples 24 h after treatment with hCG (10 IU/ml) w/wo CQ (60 μM). Mean ± SD, N = 5 biological replicates analyzed using one-way ANOVA, with Tukey’s test for multiple comparisons. E Representative confocal images of the cryosections of the testicular tissue samples 24 h after treatment with hCG (10 IU/ml) w/wo CQ (60 μM). Perilipin3 (yellow signal), LC3B (red signal) and LAMP2 (green signal). Quantification of the signal intensities and co-localizations of the signals are indicated to the right of the images. Nuclei stained with DAPI. Scale bars represent 20 μm. Mean ± SD, N = 5 biological replicates analyzed using one-way ANOVA, with Tukey’s test for multiple comparisons.

