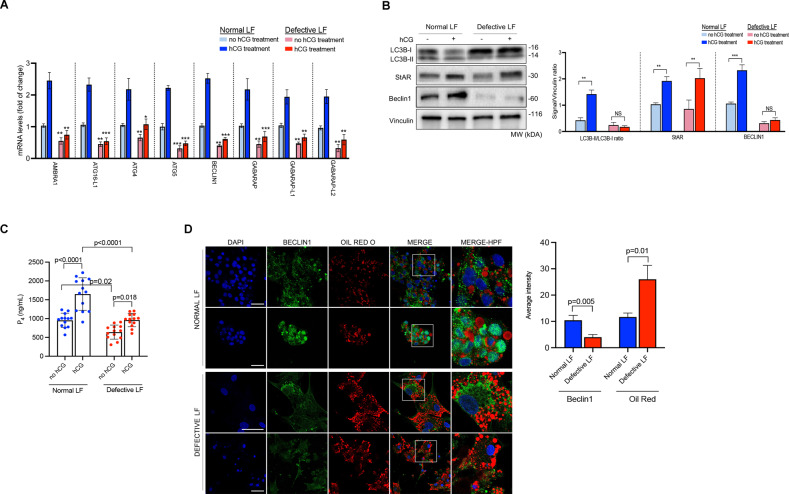
Fig. 7. Autophagic flux is compromised in patients with defective luteal function.
A Comparison of the transcripts of the indicated autophagy genes at baseline and 24 h after treatment with hCG (10 IU/ml) in the luteinized granulosa cells of the patients with normal and defective luteal function by quantitative RT-PCR. Mean ± SD, N = 13 biological replicates analyzed using one-way ANOVA, with Tukey’s test for multiple comparisons. *p < 0.01, **p < 0.001, ***p < 0.0001. B Representative blots for the indicated proteins at baseline and 24 h after treatment with hCG (10 IU/ml) in the luteinized granulosa cells of the patients with normal and defective luteal function. Densitometric quantification is indicated to the right of the blots. Mean ± SD, N = 13 biological replicates analyzed using one-way ANOVA, with Tukey’s test for multiple comparisons. NS: not significant. ***p < 0.0001. C In vitro progesterone (P4) production of the luteinized granulosa cells of the patients with normal and defective luteal function at baseline and 24 h after treatment with hCG (10 IU/ml). Mean ± SD, N = 13 biological replicates analyzed using one-way ANOVA, with Tukey’s test for multiple comparisons. D Representative confocal images of the luteinized granulosa cells stained for Beclin1 (green) and Oil Red O (red). Quantification of the signal intensities and co-localizations of the signals are indicated to the right of the images. Nuclei stained with DAPI. Scale bars represent 20 μm. Mean ± SD, N = 13 biological replicates analyzed using one-way ANOVA, with Tukey’s test for multiple comparisons.

