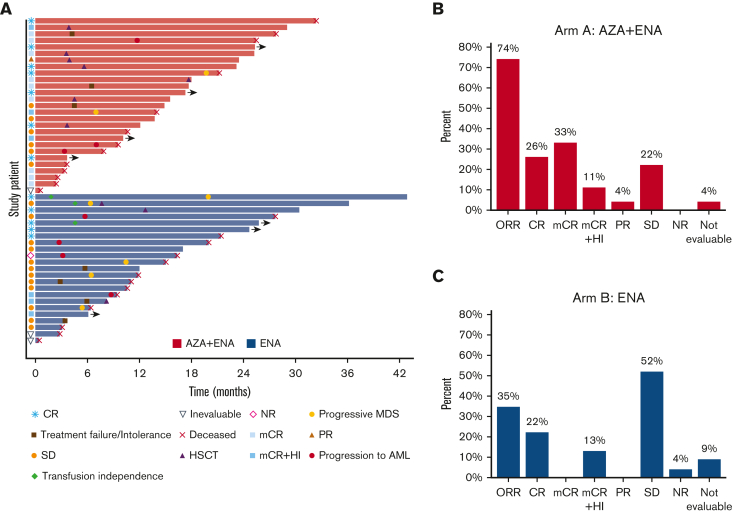
Figure 3.
Swim plot and response outcomes of the study population by treatment arm. (A) Swim plot showing individual patient, treatment duration, response, and patient disposition. (B) Proportion of responses in arm A (ENA + AZA). (C) Proportion of responses in arm B (ENA). AZA, azacitidine; ENA, enasidenib; SD, stable disease.

