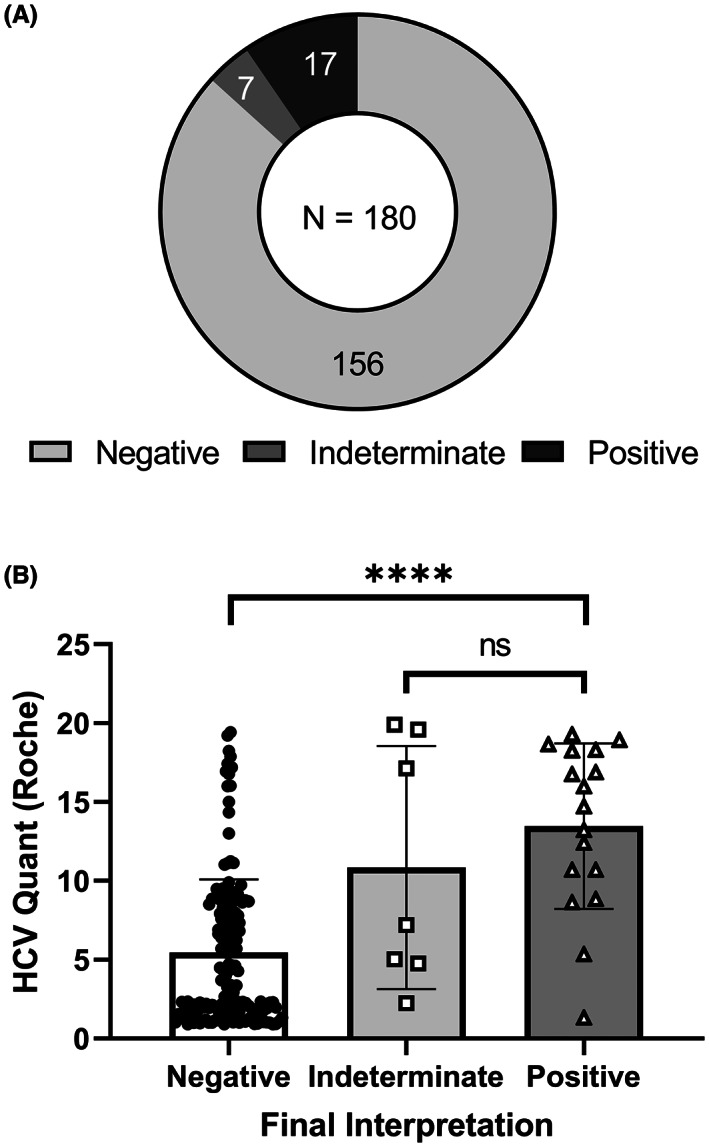
FIGURE 3.

Outcomes of sample with borderline/weakly positive Roche anti‐HCV (0.9 ≤ COI < 20). (A) Final interpretation of samples requiring second‐line serological testing. (B) Results from Elecsys Anti‐HCV II assay for all samples requiring second‐line serological testing grouped by final interpretation. Data are graphed as COI with each result displayed as a single point, and error bars representing standard deviation. Statistics were performed using Kruskal–Wallis test, with **** indicating a p‐value <0.0001 and “ns” indicating non‐significance relative to p‐value <0.05.
