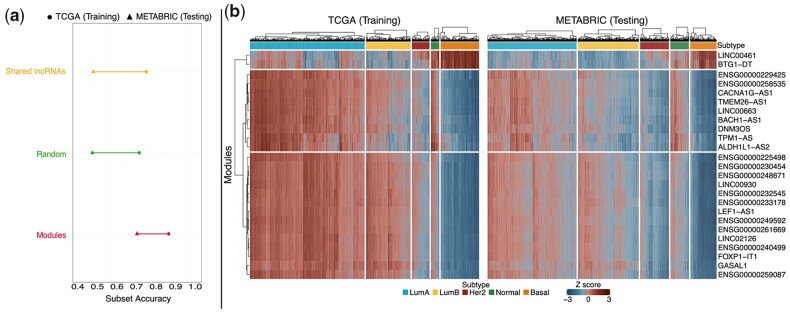
Figure 4.
Overview of results. (a) Overview of performance metrics for the Random Forest models calibrated on spongEffects modules (red), randomly defined modules (green), and lncRNAs common to both the TCGA (training) and METABRIC (testing) datasets (yellow). Subset accuracy (the proportion of samples that have all their labels classified correctly) values in training and testing for the three models. (b) Heatmaps showing the standardized spongEffects scores for the top 25 most predictive modules calculated on the TCGA and METABRIC datasets. The heatmaps show a clear separation of the Basal subtype from the remaining ones, potentially pointing to the role of miRNA-regulated modules in the aggressive and proliferative phenotype observed in this subtype.

